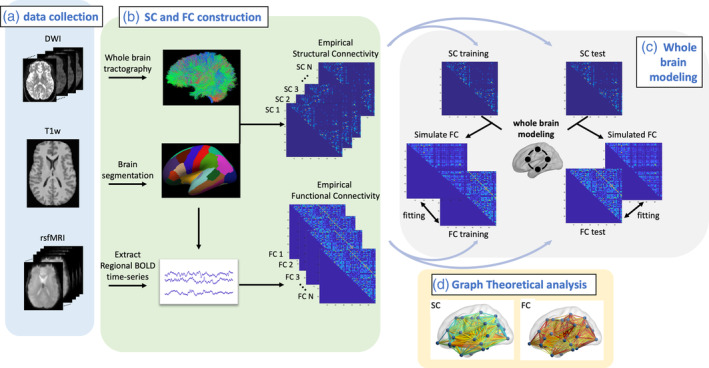
FIGURE 1.

Overview of processing pipeline. (a) We collected diffusion weighted image (DWI), T1‐weighted (T1w) structural image, and resting‐state functional MRI (rsfMRI) for each HIV+ and healthy control (HC) subject. (b) For each subject, the T1w image was segmented using Freesurfer. DWI and rsfMRI were preprocessed and coregistered to T1w image. Whole‐brain tractography for each subject was derived from DWI image, and a structural connectivity (SC) matrix was generated for each subject. The streamline count for each pair of brain regions constitutes the SC matrix. Regional BOLD time series were extracted for each subject. The Pearson's correlation coefficient of the BOLD time series of two brain regions constitutes the functional connectivity (FC) matrix. (c) Whole‐brain dynamic modeling, specifically, relaxed mean field dynamic modeling (rMFM), is used to study the neuronal dynamic changes between HIV+ subjects and HC subjects. (d) We also used graph theoretical analysis to investigate the topological changes by comparing the SC and FC for HIV+ subjects with HC subjects
