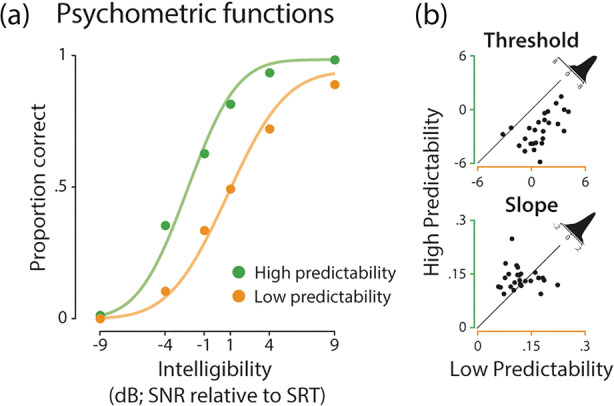
FIGURE 2.

Behavioural results of the sentence repetition task. (a) Psychometric functions (coloured lines) were fitted to the proportion of correctly repeated keywords (coloured dots) across intelligibility levels for sentences with low (orange) and high predictability (green); grand average is displayed for illustration purposes. (b) The threshold of sentences with low predictability shifted towards more intelligible levels when compared to sentences with high predictability (p < .001; top). There was no evidence for a slope difference between sentences with low and high predictability (p = .122; bottom). Density plots illustrate the difference between the proportions correct of sentences with high vs. low predictability
