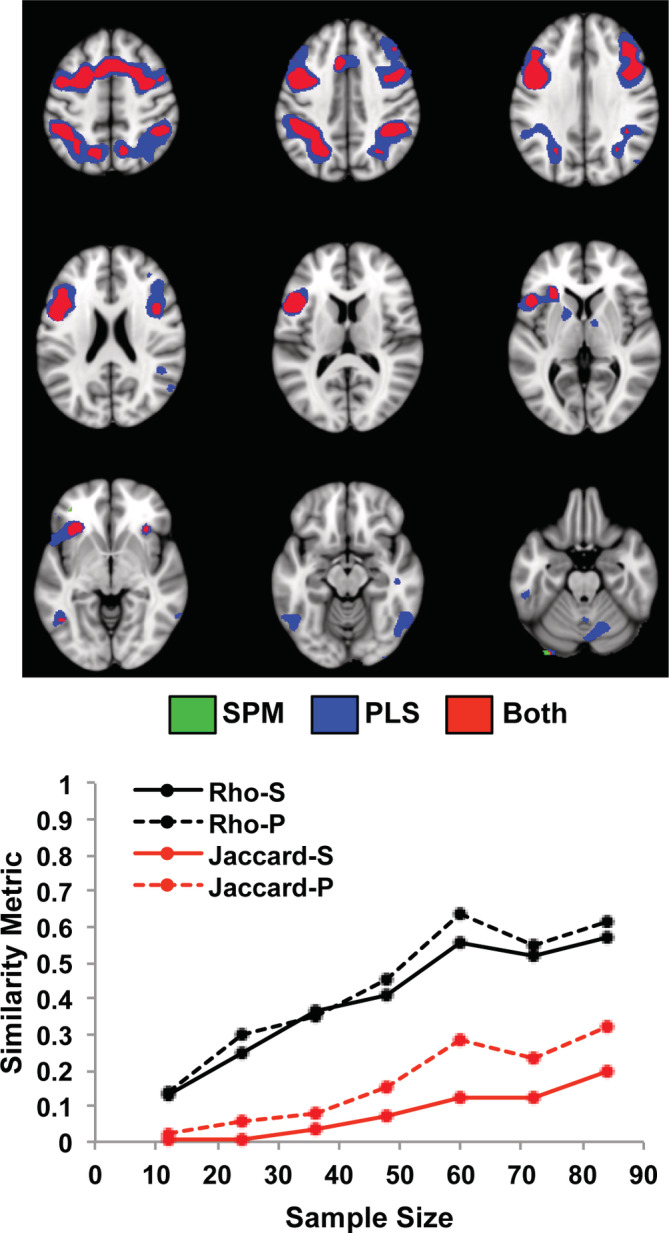
FIGURE 2.

The impact of sample size on the correlations between brain activation and task accuracy is shown for the Dallas data set using SPM and PLS. The graph shows the mean rho (black) and the mean Jaccard values for positive correlations (red), for each sample size. “S” refers to SPM, and “P” refers to PLS. The spatial maps show the regions that were positively correlated with accuracy (mean maps for the two subsamples with 84 participants for SPM and PLS). Negative correlations were limited to only a few voxels in dorsomedial prefrontal cortex and are not shown here. The threshold used for these maps was t > 3 for SPM and BSR > 3 for PLS. Voxels identified by SPM are shown in green, those identified by PLS are shown in blue, and overlapping voxels are shown in red
