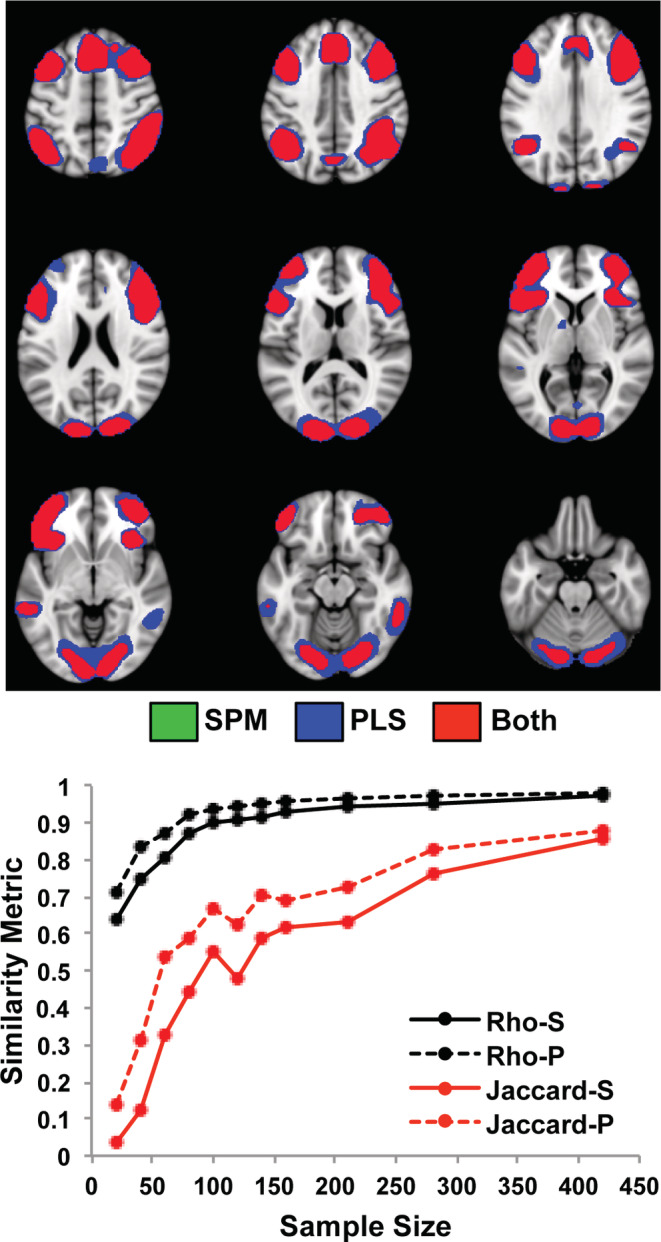
FIGURE 5.

The impact of sample size on the task effect is shown for the HCP data set using SPM and PLS. The graph shows the mean rho (black) and mean Jaccard values for the contrast of relational task > control (red), for each sample size. “S” refers to SPM, and “P” refers to PLS. The spatial maps show the regions with more activity for the relational task in the samples with the maximum size (mean of the two 420‐participant subsamples for SPM and PLS). The threshold used for these maps was t > 5 for SPM and BSR > 5 for PLS. There were no voxels identified by SPM and not PLS (no green voxels) but almost all of the regions showed slightly more extensive voxels identified by PLS (blue); overlapping voxels are shown in red
