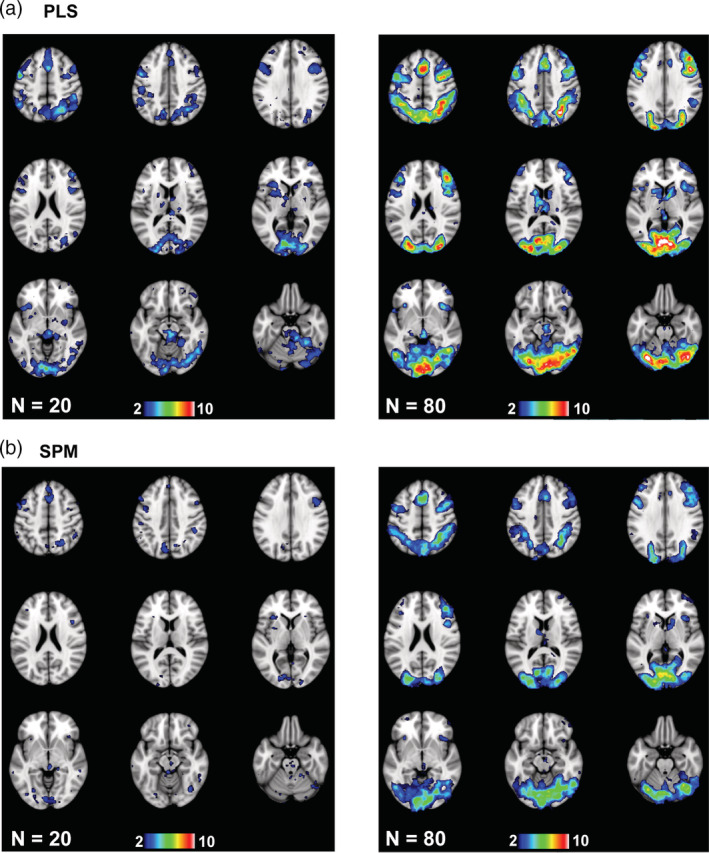
FIGURE 7.

The penetration maps are shown for the HCP data set for two sample sizes (see text for an explanation of the choice of the two sample sizes). These maps show voxels with at least two overlapping maps for PLS (a) and SPM (b). The color bars indicate the number of overlapping maps: from 2 to a maximum of 10 maps for the 20‐participant subsamples, and from 2 to a maximum of 10 maps for the 80‐participant subsamples
