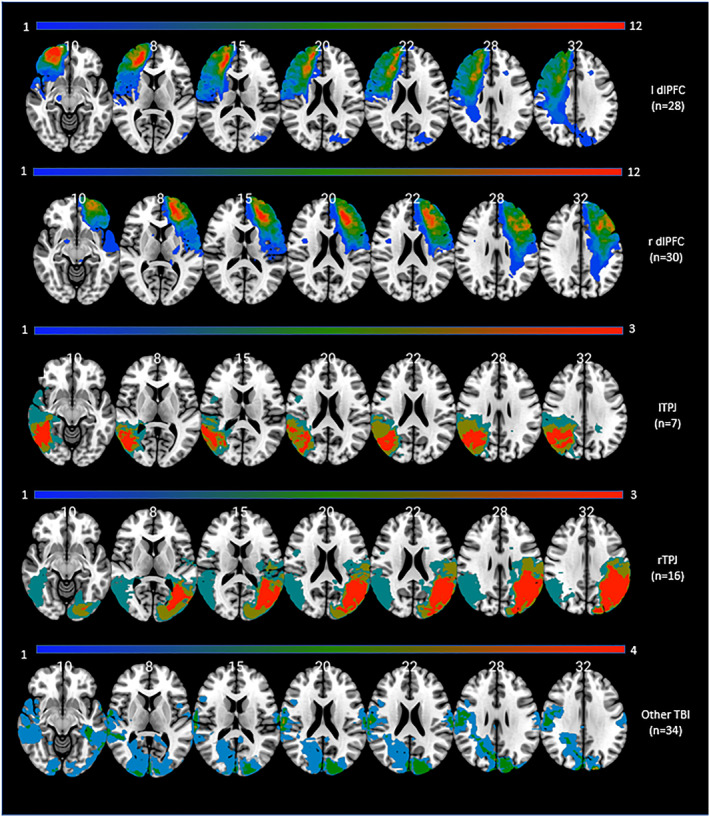
FIGURE 1.

Lesion overlay maps of TBI patients (n = 115) grouped by lesion location. Numbers on the top of the brain slices indicate the z coordinates (MNI) of each axial slice. The color indicates the number of veterans in the group with damage to a given voxel. The greatest lesion overlap (red) occurred in the regions of interest. Images are in radiological space (i.e., right is left). For interpretation of the references to color in this figure legend, the reader is referred to the web version of this article. TBI, traumatic brain‐injury
