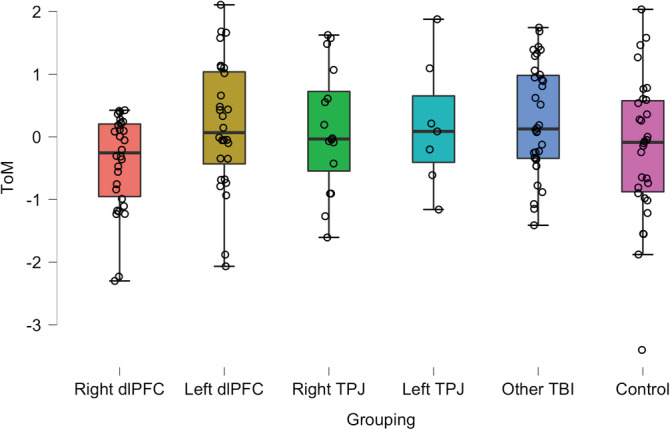
FIGURE 2.

Box plots describing the performance on the Strange Stories task across the study groups. The Y axis represents the standardized residuals of the difference score between ToM and physical story conditions after controlling for individual differences in preinjury intelligence, years of education, WAIS working memory index score, and the WAIS verbal comprehension index score. The horizontal line within each box indicates the value of the group median. Figures constructed using JASP Version 0.12.2 (JASPTeam, 2020). WAIS, Wechsler Adult Intelligence Scale
