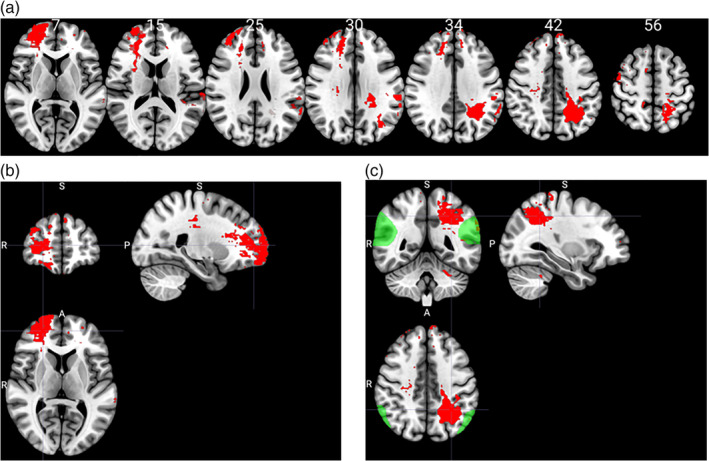
FIGURE 4.

(a) Voxel‐based lesion‐symptom mapping analysis results. In red are areas of damage that were associated with a deficit in ToM. Values in white indicate the z coordinates (MNI) of each axial slice. (b) Center MNI coordinates for the main cluster in the right hemisphere. (c) Center MNI coordinates for main cluster in the left hemisphere. In green are the right and left temporoparietal junction (maps downloaded from https://saxelab.mit.edu/use‐our‐theory‐mind‐groupmaps). Images are in radiological space (i.e., right is left)
