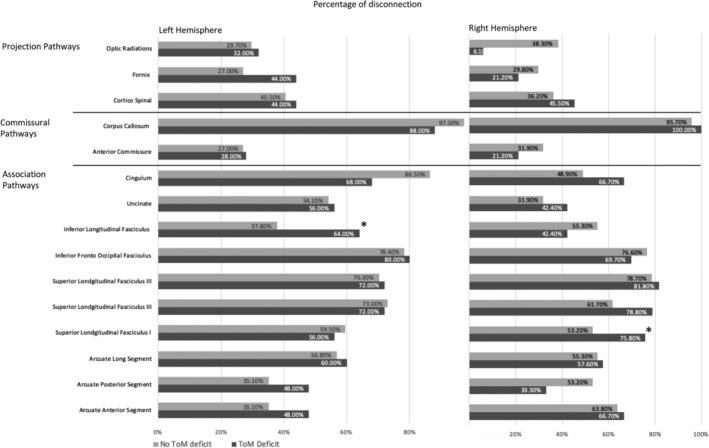
FIGURE 5.

Percentage of patients with disconnection in projection, commissural and association white matter pathways within the left and right hemisphere, calculated for groups with and without a deficit in ToM performance. * denotes a significant group difference, p < .05
