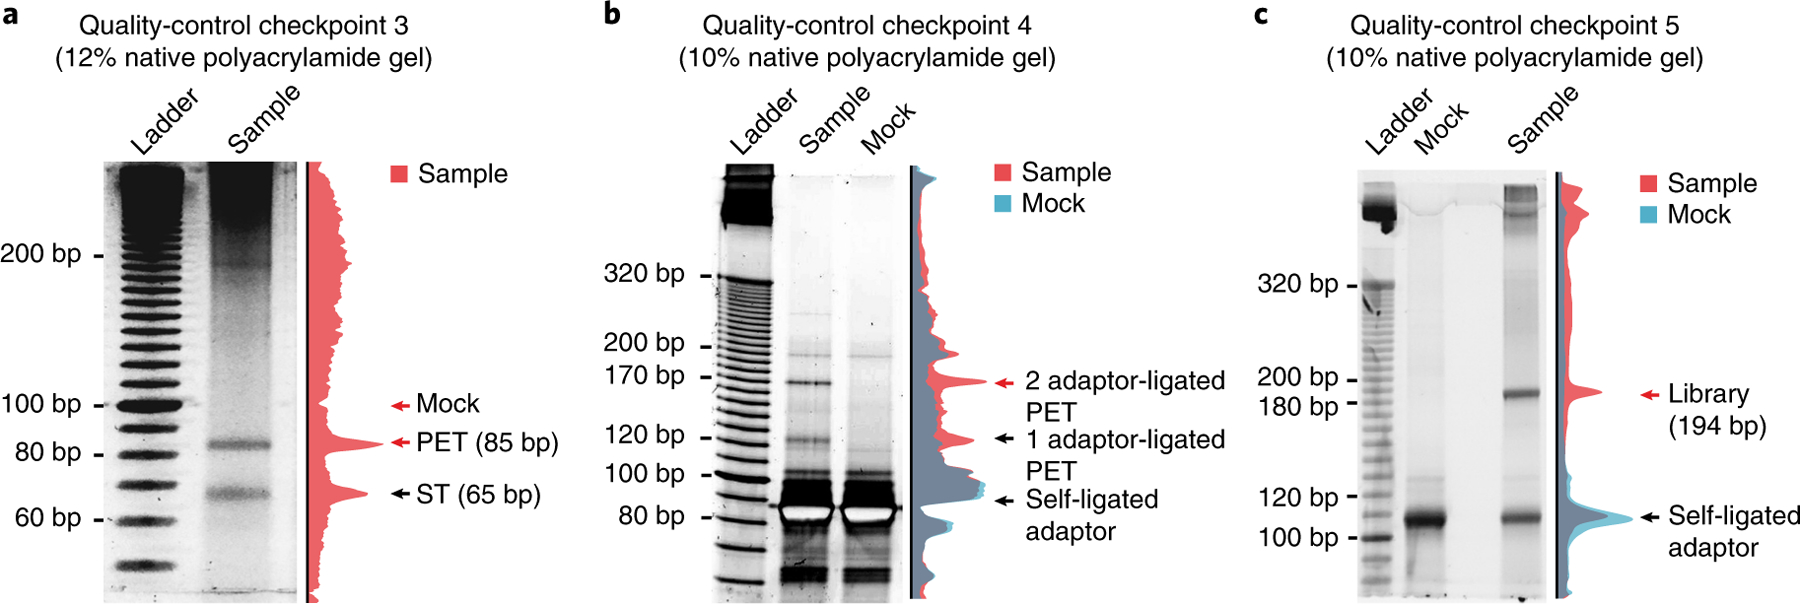
Fig. 2 |. Exemplary gel images of library products.

a, Polyacrylamide gel image of library products after paired-end tagging by MmeI. Red arrows indicate the locations where gel slices are cut and DNA is recovered. Although lacking discernable bands, the slice that was cut at ~100 bp for the mock sample (see Step 114 for details) contains adequate background DNA to serve as a control sample for downstream steps. Image adapted with permission from Li et al.8, Springer Nature. b, Polyacrylamide gel image of library products after adaptor ligation. The two distinct bands in the sample lane are adaptor-ligated products. The red arrow indicates the band containing the product ligated at both ends that needs to be recovered for downstream steps in library construction. c, Polyacrylamide gel image of library products after PCR amplification. The final library products, indicated by the red arrow, all have a precise size of 194 bp. The sample lanes of the gel images in a, b and c are quantified, and the normalized intensity is illustrated on the right side of each gel. PET, paired-end tag that denotes a linker simultaneously ligated with RNA and DNA on each side; ST, singleton tag that denotes one-side-ligated linker.
