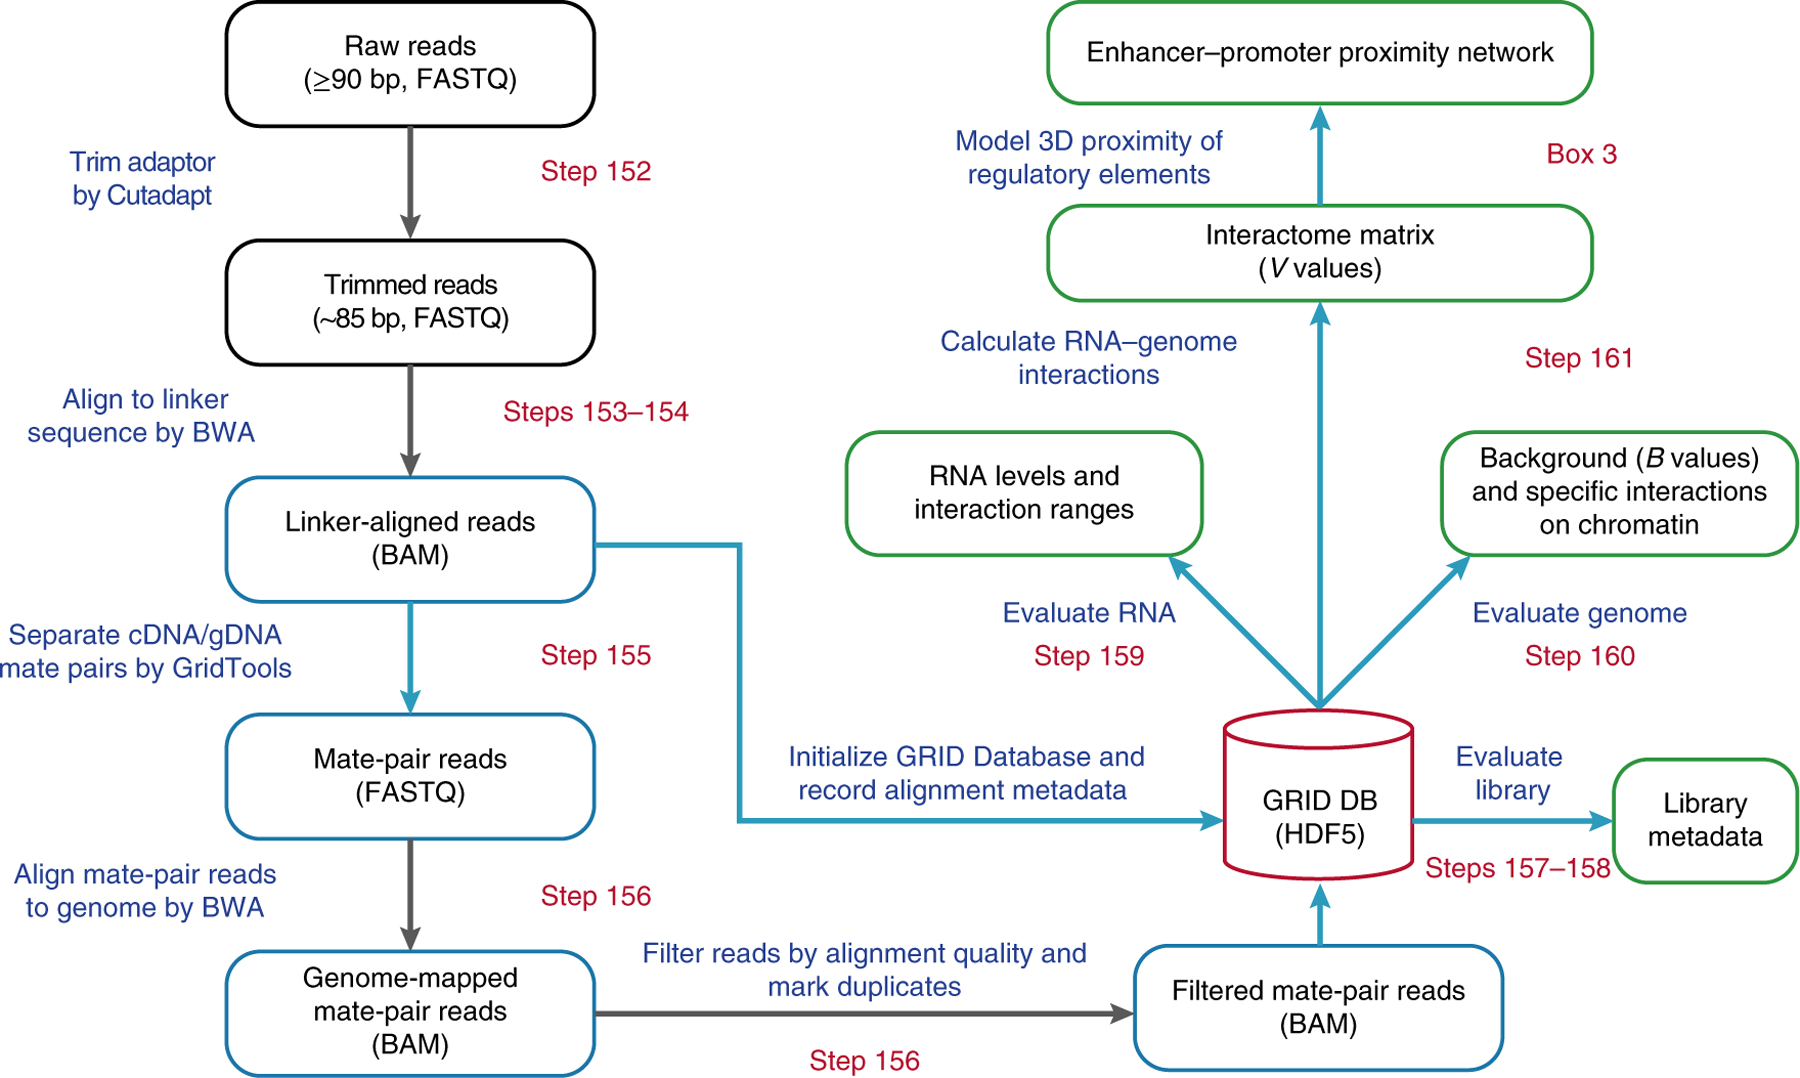
Fig. 3 |. Flowchart of the GRID-seq data-processing pipeline.

Stages of the pipeline are outlined, and key steps are shown in the boxes. Starting from the raw sequencing reads, the adaptor sequences are trimmed off. The resulting sequence length is denoted in the parentheses. The position of the linker is identified by BWA alignment, and the flanking sequences are split into mate pairs of RNA and DNA reads, based on the orientation of the linker. The mate-pair reads are next aligned to the reference genome. Only uniquely mapped read-pairs are stored in the GRID Database, which also stores various metadata generated during the pipeline as a hub for further analyses (green boxes). By evaluating the captured RNAs and genomic loci, a genome-wide interactome is calculated as a matrix, reporting specific interaction signals of all chromatin-associated RNAs on the binned genome. Steps processed by the in-house software, GridTools, are labeled with blue boxes and arrows. File formats are denoted in parentheses for certain steps.
