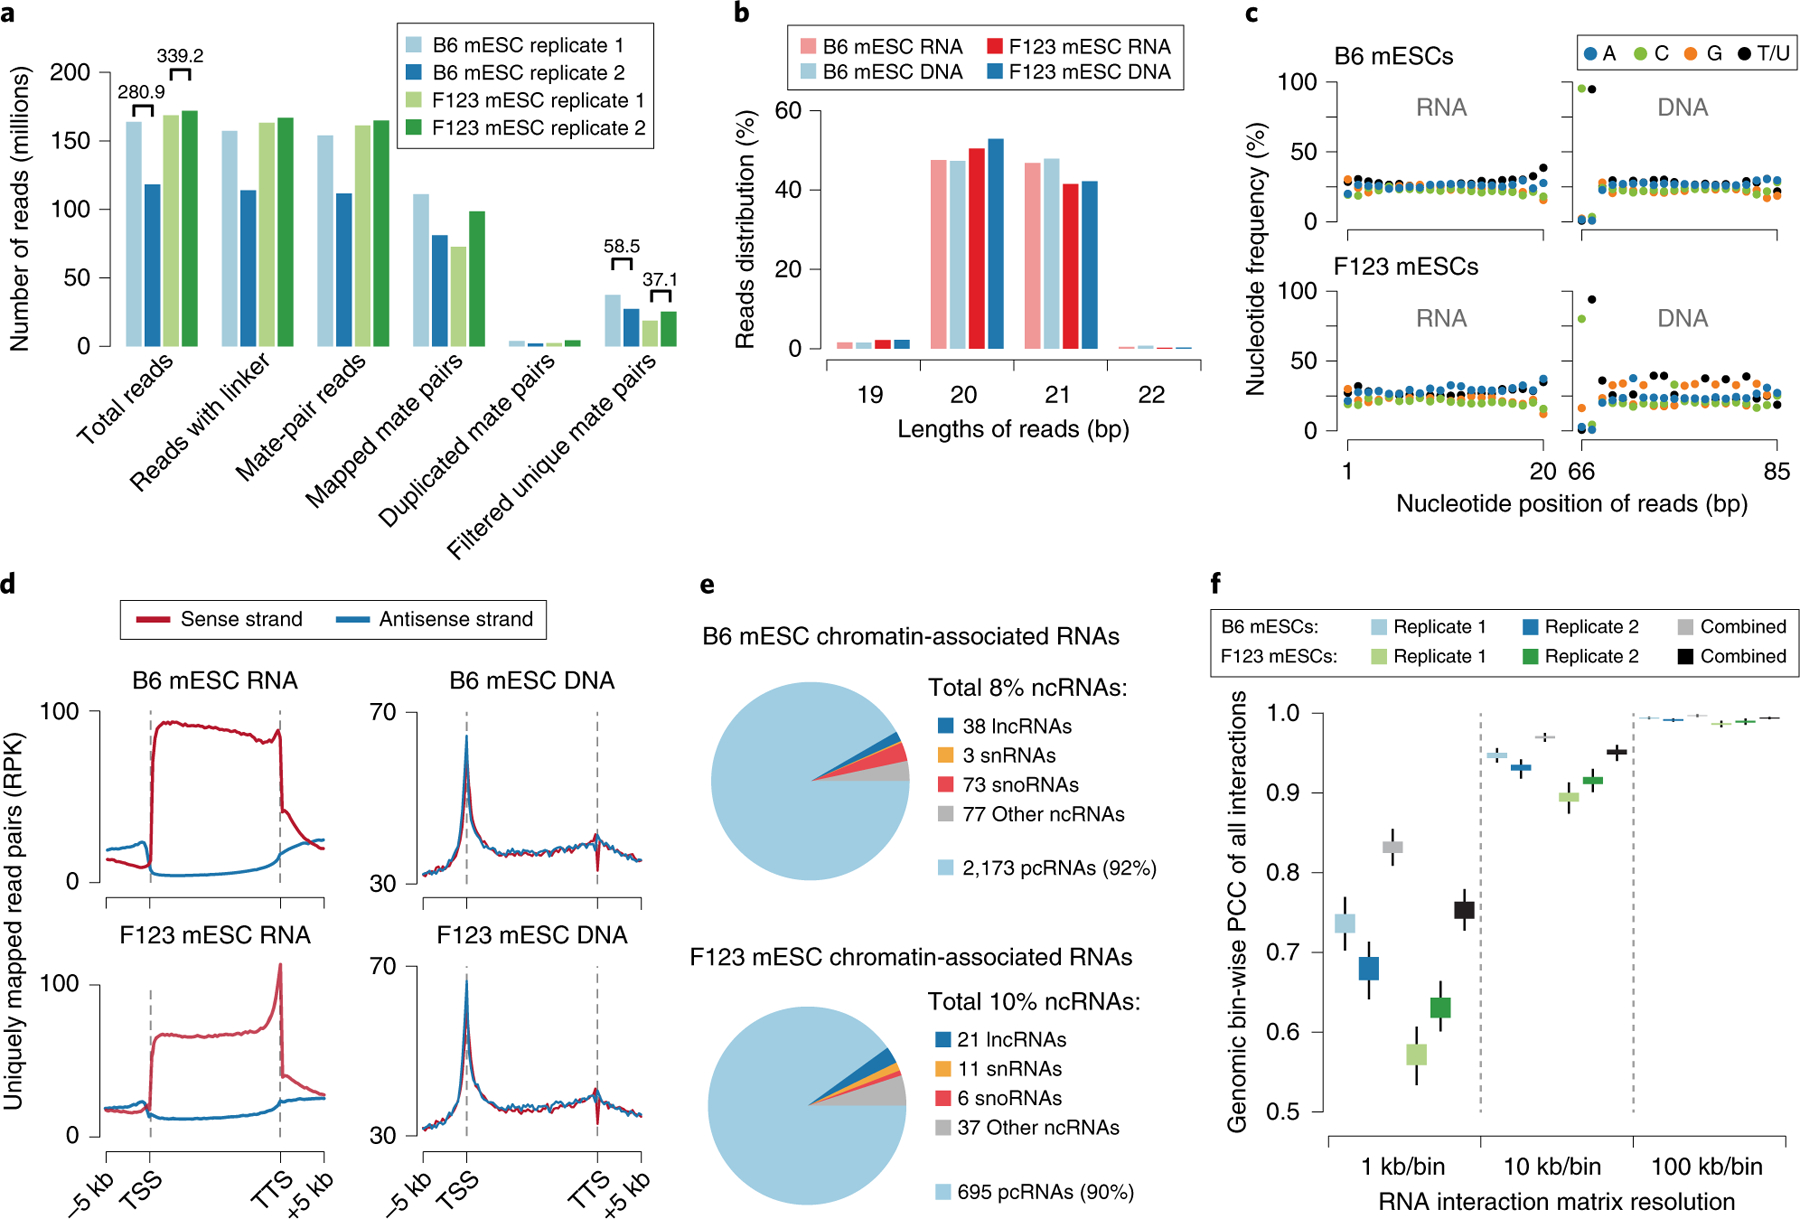
Fig. 4 |. GRID-seq data quality and features.

a, Summary of sequenced GRID-seq libraries constructed on two mouse embryonic stem cell (mESC) lines (B6 and F123). Shown are numbers of reads and read mate pairs remaining after individual data-processing steps. The filtered unique mate pairs are used for interaction density calculation. The numbers above the bars represent the replicate-combined number of reads. b, Summary of the RNA/DNA read length of each mESC library. c, Nucleotide frequency of RNA (left) and DNA (right) reads. Note the specific dinucleotide as part of the AluI recognition site at the end of DNA reads, but the lack of nucleotide bias in any position of RNA reads. d, Metagene profiles showing RNA or DNA read coverage on regions from 5 kb upstream of the transcription start site (TSS) to 5 kb downstream of the transcription termination site (TTS) of all annotated genes in the mouse genome. Strand-specific alignment of uniquely mapped RNA (left) and DNA (right) reads relative to gene annotation. Note that mapped RNA reads have the same strand specificity as their transcripts, but this is not the case for DNA. e, Types of chromatin-associated RNAs identified in the two libraries. The summarized percentages of all non-coding RNAs (ncRNAs) are shown in the legend. Among these, the numbers of identified species of long non-coding RNAs (lncRNAs), small nuclear RNAs (snRNAs), small nucleolus RNAs (snoRNAs), and other types of ncRNAs are shown to the side of their respective categories. The percentage and number of identified protein-coding RNAs (pcRNAs) are also shown at the bottom. f, Pearson’s correlation coefficient (PCC) of GRID-seq interaction density of each chromosome at decreasing resolution (increasing bin size) across the mouse genome in the two mESC libraries. Boxes range from the lower quartile to the upper quartile of the data, and the whiskers extend to a 1.5× interquartile range beyond the boxes. RPK, reads per kilobase.
