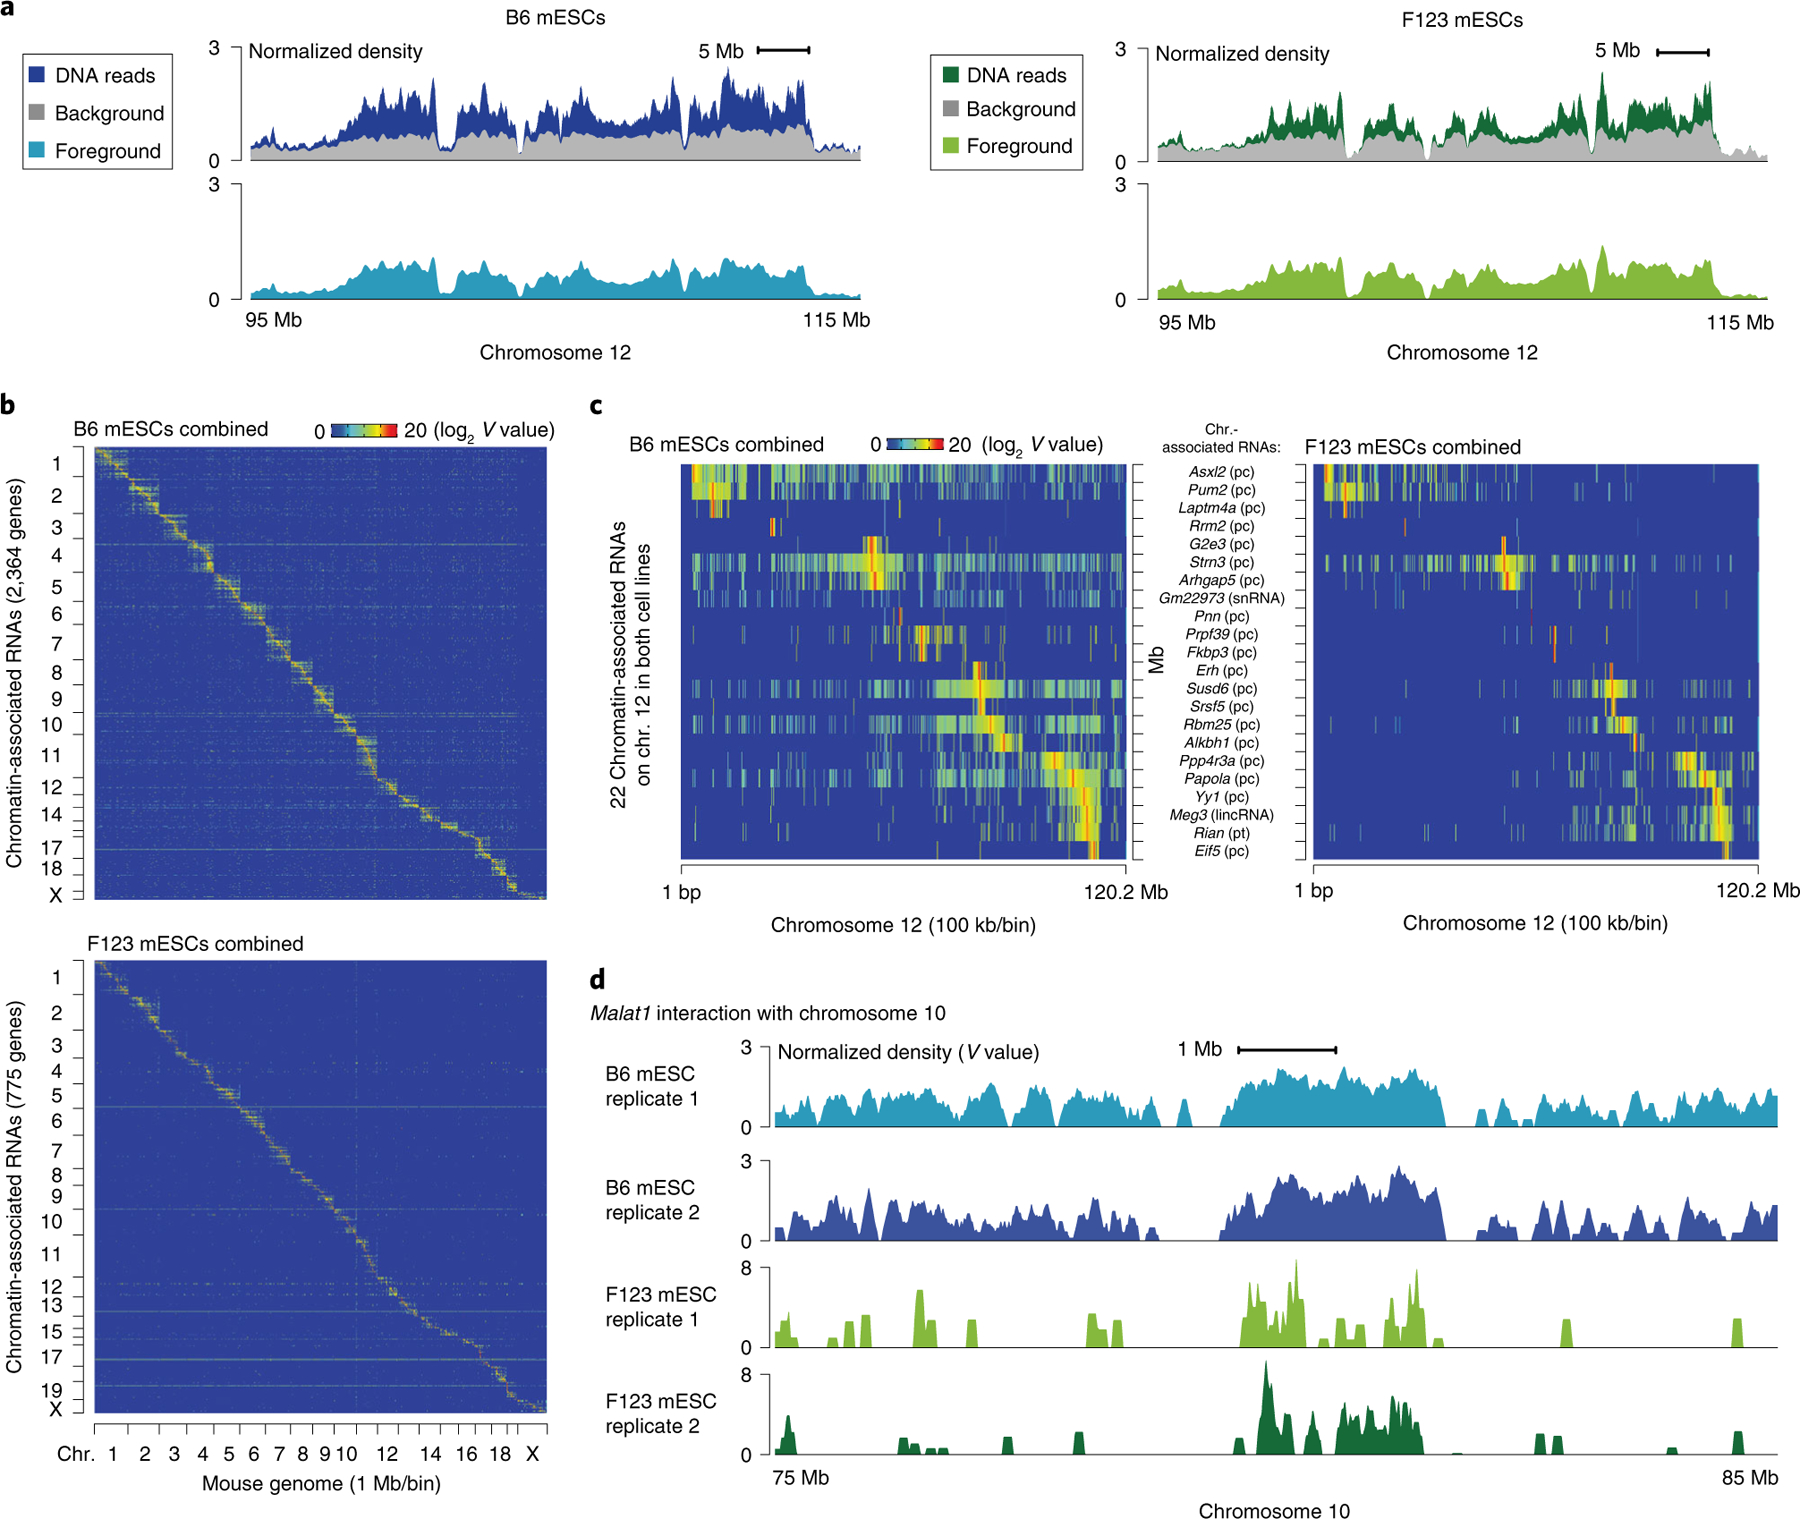
Fig. 5 |. Statistical models and GRID-seq derived RNA–chromatin interaction matrix.

a, Foreground (light blue and light green) and background (gray) in a highlighted region of chromosome 12 relative to the GRID-seq raw signals (dark blue and dark green). The background is derived from the collection of trans-acting protein-coding mRNAs in the two mouse ES cell lines, B6 mESCs and F123 mESCs. Foreground and background are shown in normalized density for comparison. b, Heatmap showing chromatin-associated RNAs across the whole mouse genome in B6 (top) and F123 mESCs (bottom), obtained from combining two biological replicates. Row: chromatin-associated RNAs ordered by their gene locations. The total numbers of chromatin-associated RNA species are denoted in the parentheses in the y-axis label. Column: mouse genome in 1 Mb/bin resolution. c, Two enlarged representative regions on chromosome 12, showing only common chromatin-associated RNAs in both mESC lines that are transcribed from chromosome 12. Cell-specific RNA–chromatin interaction patterns in B6 (left) and F123 mESCs (right) are shown at 100 kb/bin resolution. RNA names are shown in the middle, followed by their respective types in parentheses. d, Detailed Malat1–chromatin interaction peaks in a representative region of chromosome 10 in replicates of the two mESC datasets. chr., chromosome; pc, protein-coding; pt, processed transcript; V, interaction density.
