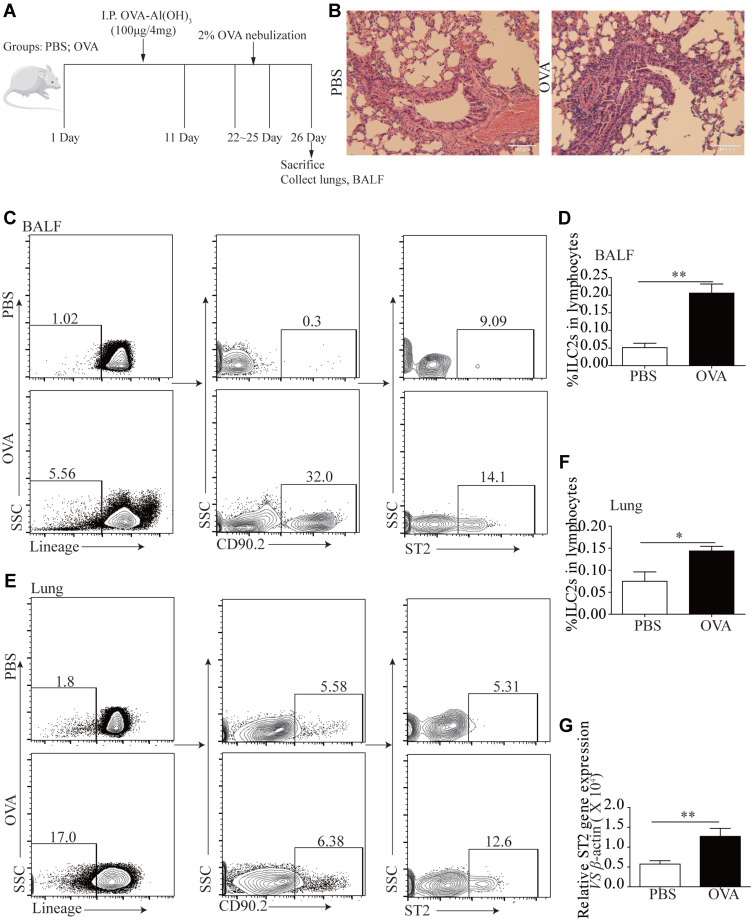
Figure 3.
ILC2s and ST2 was elevated following OVA-induced asthma. A cohort of Balb/c mice were either induced with PBS or OVA by intraperitoneal injections and four days according to the scheme, n = 8. (B) H&E staining was performed on PBS and OVA treated mice lung tissue sections. (C) Representative diagrams of flow cytometry analysis of the percentages of ILC2s in the BALF of OVA and PBS treated mice. (D) Frequencies (n = 8) of percentage of ILC2s in mice BALF. (E) Representative diagrams of flow cytometry analysis of the percentages of ILC2s in the lung of OVA and PBS treated mice. (F) Frequencies (n = 8) of percentage of ILC2s in mice lung. (G) RT-PCR results of the relative expression of ST2 in mice lung tissue. Data are presented as mean ± SD, *P < 0.05; **P < 0.01 compared with control.

