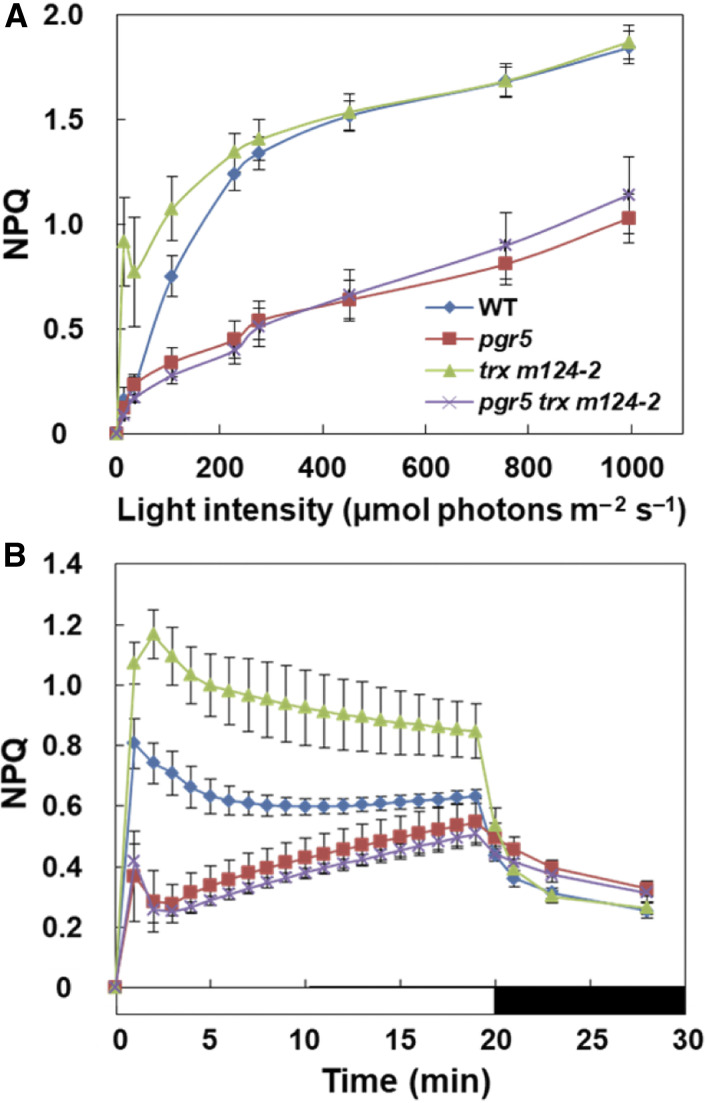
Figure 2.
In Vivo Analysis of Chlorophyll Fluorescence.
(A) Dependence of the NPQ on the light intensity in the wild type (WT), pgr5, trx m124-2, and pgr5 trx m124-2. NPQ values were recorded 2 min after a shift to each light intensity.
(B) Time courses of the NPQ induction and relaxation. NPQ values were measured during the actinic illumination with 62 µmol photons m–2 s–1 for 20 min, followed by relaxation in the dark for 8 min. Each data point represents the mean ± sd (n = 5 independent plants).

