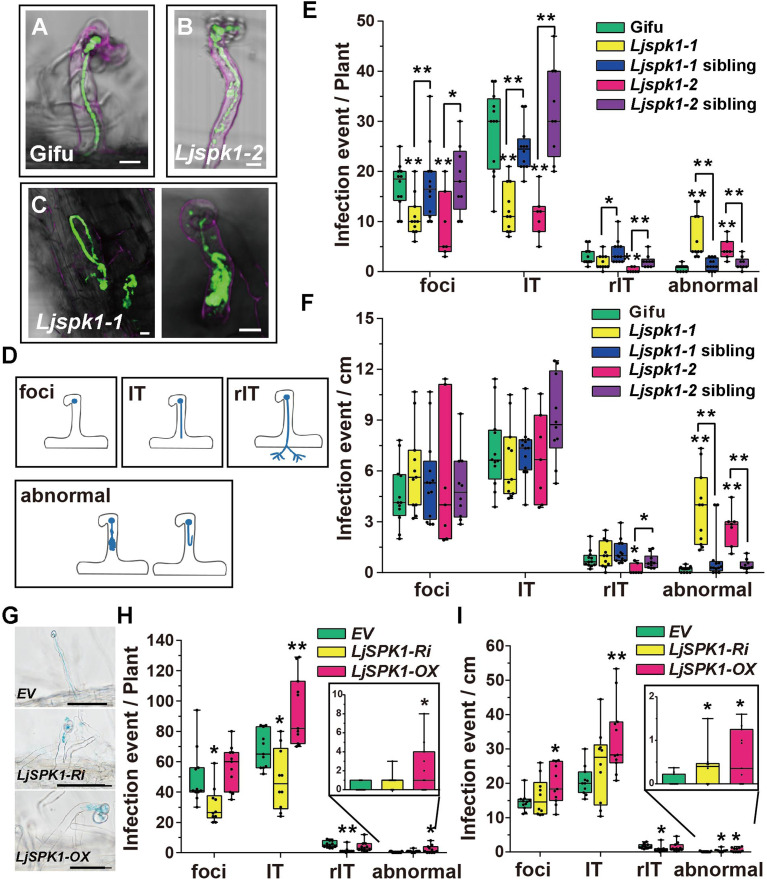
Figure 2.
ITs in Ljspk1 Mutants Are Abnormal Compared with Wild-Type L. japonicus.
(A) to (D) Normal elongating ITs in the wild type (Gifu) (A) and typical abnormal infection events in the Ljspk1 mutants (B) and (C) at 1 week after inoculation with M. loti R7A/GFP. Roots were counterstained with propidium iodide before observation. Green fluorescence shows normal infection foci and a normal IT in a curled root hair in the wild type, whereas Ljspk1 mutants show abnormal infection processes, such as sac-like or looped ITs (B) and (C). Bars = 10 μm. (D) A cartoon diagram of the infection events. Foci, infection foci; IT, IT in an epidermis cell; rIT, IT extending into a cortex cell; abnormal, abnormal IT in root hairs.
(E) and (F) Boxplots representing the number of infection events in wild-type, Ljspk1 siblings, and Ljspk1 mutants. Total number of infection events per plant (E) and number of infection events per centimeter root (F) were scored at 1 week after inoculation with M. loti R7A/lacZ. Asterisks indicate a significant difference (*P < 0.05, **P < 0.01, Student’s t test, comparison between the wild type and mutants).
(G) to (I) IT phenotypes (G) and infection events ([H] and [I]) in wild-type L. japonicus hairy roots expressing control plasmid (EV), LjSPK1-Ri, or LjSPK1-OX. Total number of infection events per plant (H) and number of infection events per centimeter root (I) scored 1 week after inoculation with M. loti R7A/lacZ. Abnormal infection events are enlarged in the inset in (H) and (I). Asterisks indicate a significant difference (*P < 0.05, **P < 0.01, Student’s t test, comparison between EV control and experimental group). Bars = 50 μm.
For each boxplot, the center line in the box shows the median; the box limits are the upper and lower quartiles; the whiskers represent the maximum and minimum values.

