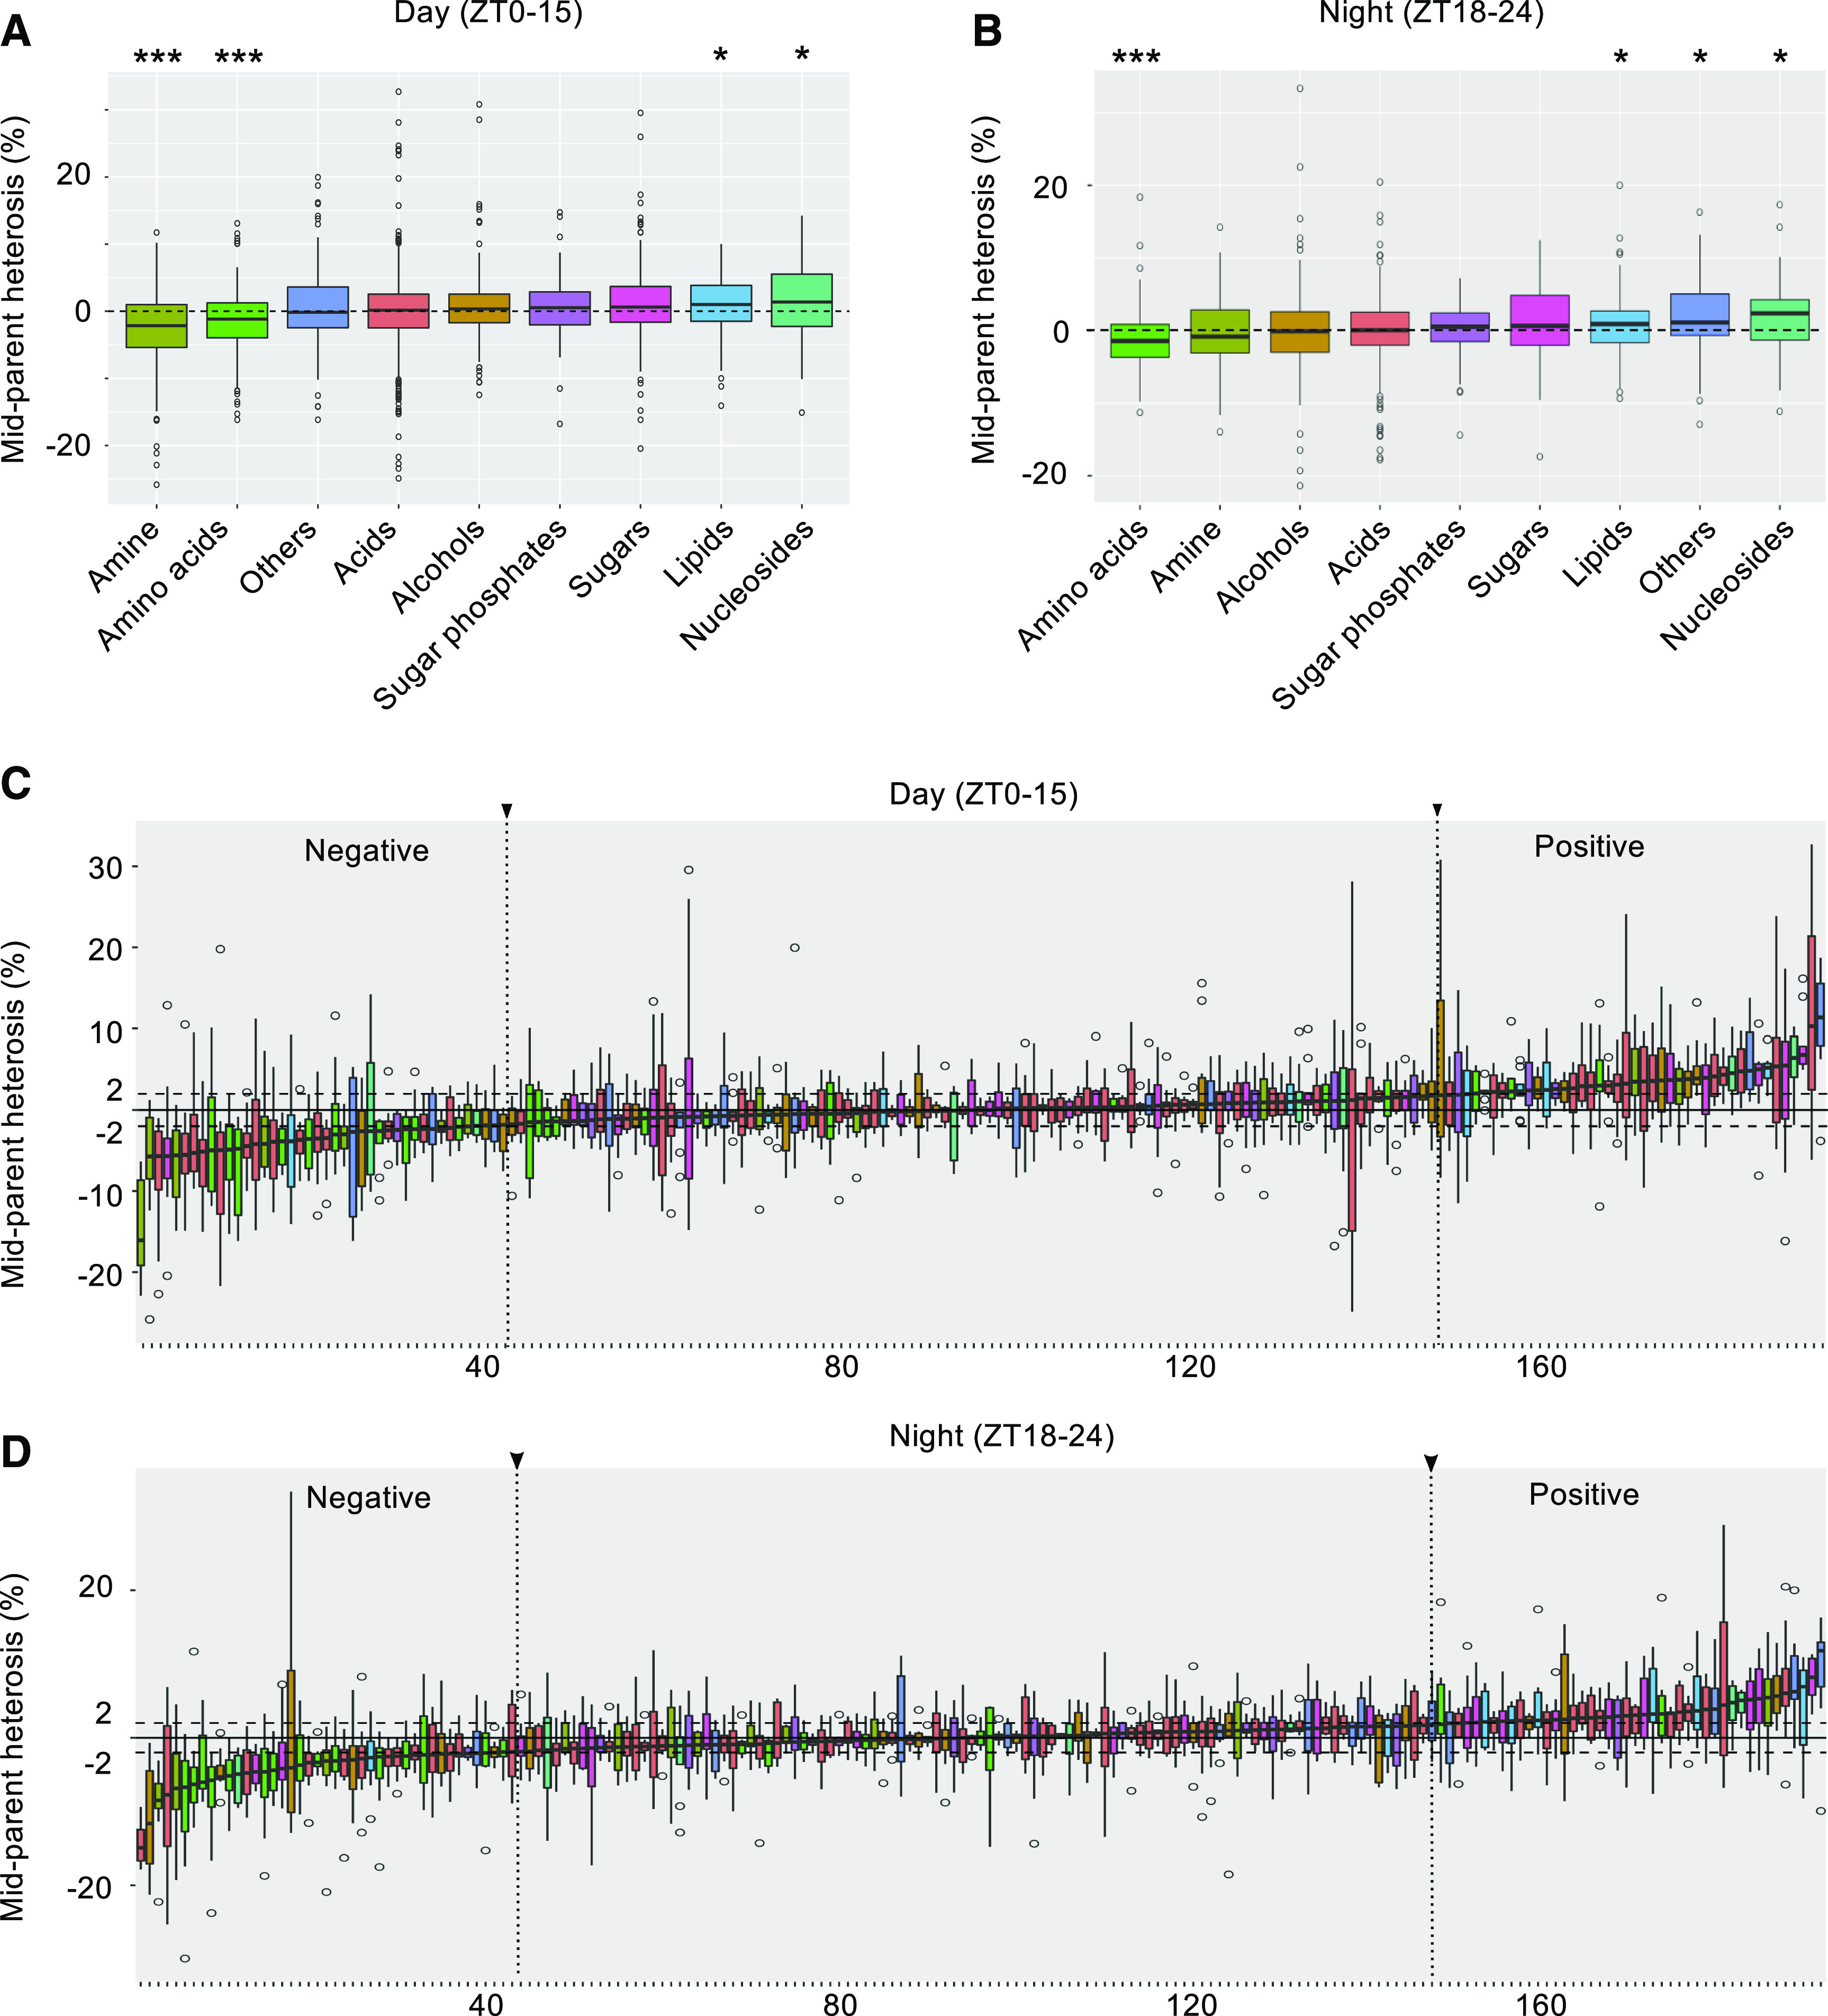
Figure 3.

Diel Regulation of Metabolic Heterosis in Maize.
(A) and (B) Boxplot showing the distribution of relative MPH in each metabolic category during the day (ZT0, ZT3, ZT6, ZT9, ZT12, and ZT15) and at night (ZT18, ZT21,and ZT24). One and three asterisks indicate the mean value of MPH at statistically significant levels of P < 0.05 and P < 0.0005, respectively (one-sample Student’s t test).
(C) and (D) Boxplots showing the distribution of MPH for each known metabolite during day and night time points. Negative heterosis (median MPH value < −2%) and positive heterosis (median MPH value > 2%) are indicated by dashed lines. The color code in Figures 3C and 3D is the same as in Figures 3A and 3B. Vertical dotted lines indicate the cut-off for metabolites with negative or positive MPH.
