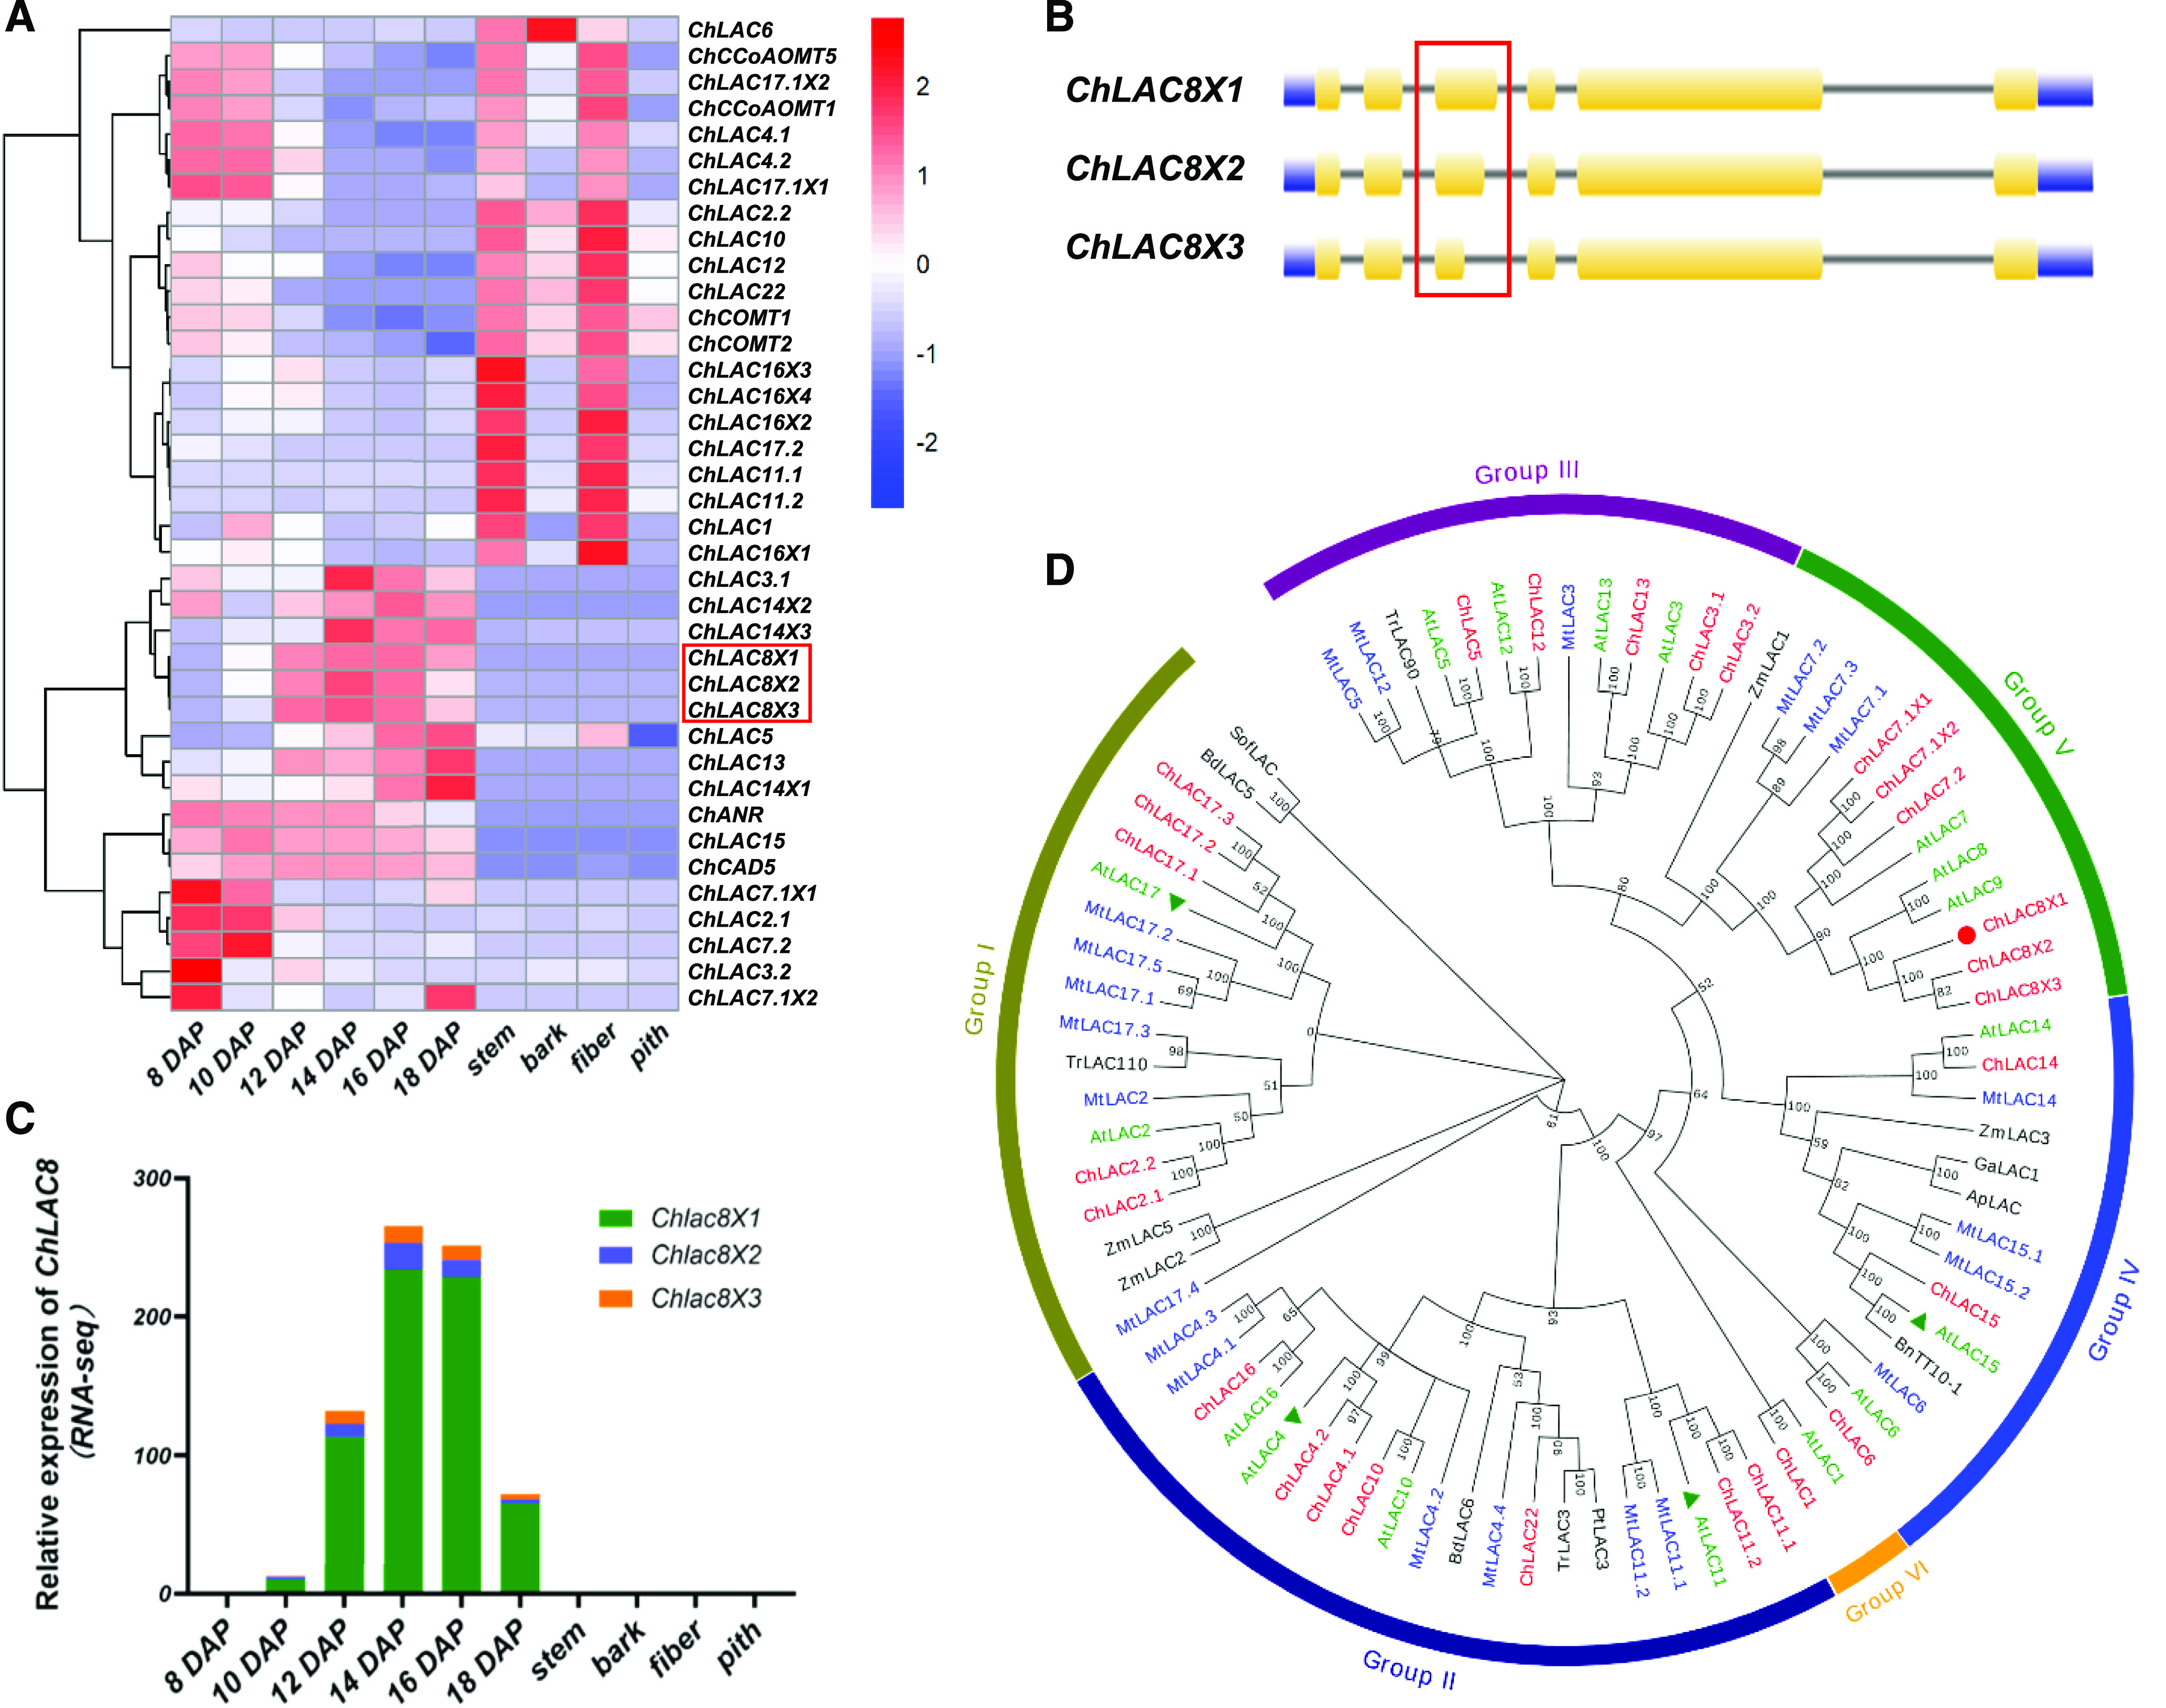
Figure 1.

Transcript Level Profiles and Phylogenetic Analysis of Laccases Derived from C. hassleriana.
(A) Hierarchical clustering analysis of transcript levels of 32 ChLAC Cleome genes in different tissues and different stages of seed development. FPKM values (transcript levels) were transformed to log2(FPKM+1) for color scaling. The heatmap was drawn using the “pheatmap” package in the software R. The heatmap also shows the transcript levels of ChCAD5 (involved in C-lignin biosynthesis), ChCOMT1/2 and ChCoAOMT1/5 (encoding enzymes of G-lignin biosynthesis downregulated at the onset of C-lignin biosynthesis), and ChANR (associated with CT biosynthesis).
(B) Gene structure analysis of ChLAC8. ChLAC8X1, ChLAC8X2, and ChLAC8X3 arise from the same gene locus (LOC104823484) as a result of alternative splicing. The red box shows the third intron where the alternative splicing event takes place.
(C) Transcript levels of the three ChLAC8 transcript variants.
(D) Phylogenetic tree of laccases from C. hassleriana and other plants. The tree was constructed using the software MEGA 7.0 with neighboring-joining phylogeny testing and 1,000 bootstrap replicates. The Cleome ChLACs are in red, AtLACs from Arabidopsis are in green, and the Medicago laccases are in blue. The functionally characterized AtLACs (AtLAC4, 11, 15, and 17) are indicated by green triangles. The ChLAC8 characterized in this study is marked by a red circle. The accession numbers of the laccases are given in Supplemental Table 2. All laccase protein sequences are given in Supplemental Data Set 2.
