Figure 5.
Map-Based Cloning and Expression of EPAD1.
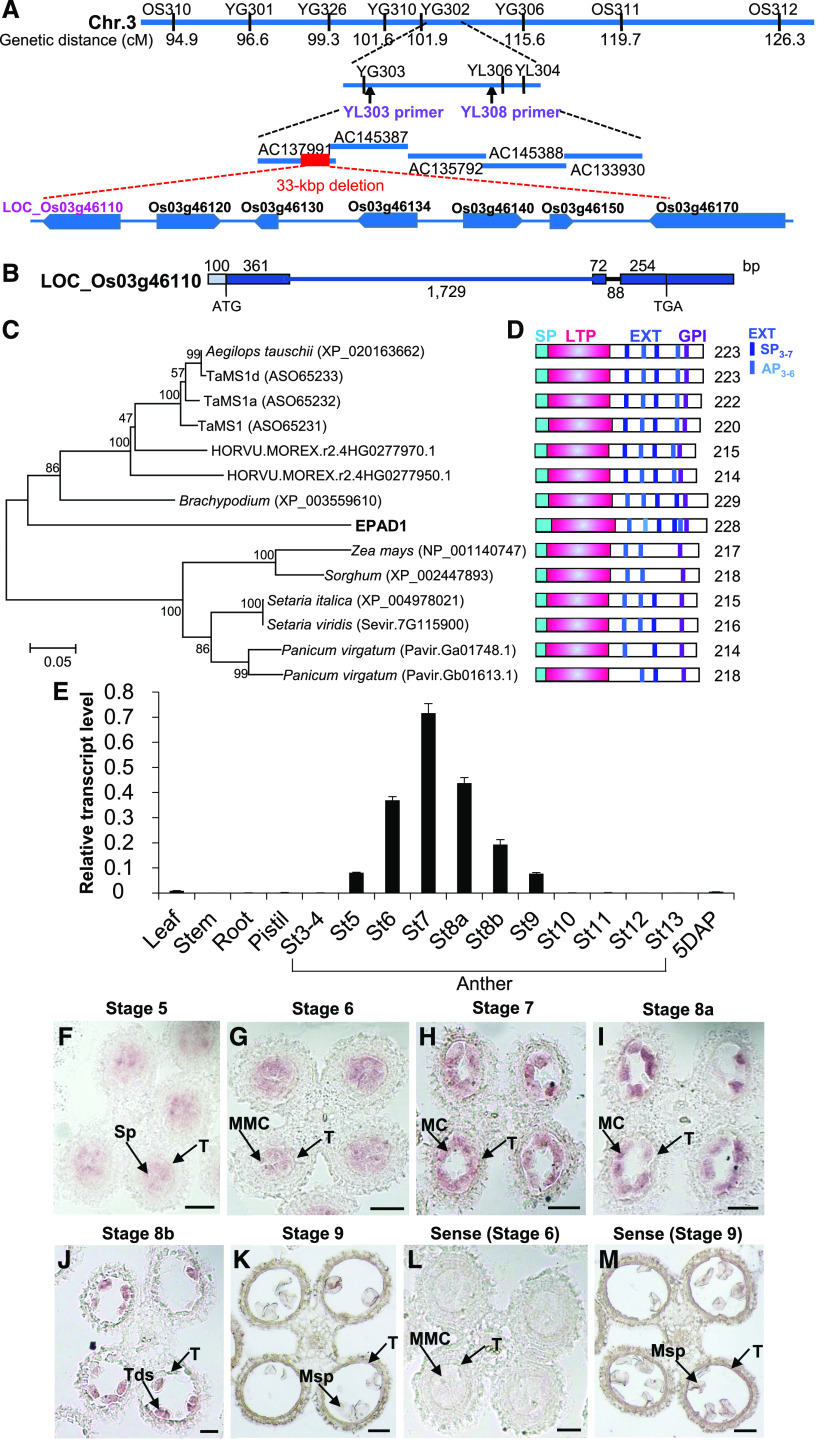
(A) Fine mapping of the EPAD1 gene. Names and positions of the molecular markers and primers are shown. The red dashed line shows the 33 kbp deleted region in epad1 plants. cM, centimorgan.
(B) Schematic representation of the gene organization of EPAD1 (Os03g46110). Boxes indicate exons and intervening lines indicate introns. Numbers indicate sequence length, in bp.
(C) Phylogenetic tree of EPAD1 and its orthologs from other species (Supplemental File 2). Scale bar indicates number of expected changes per amino acid residue.
(D) Schematic representation of functional domains in EPAD1 and its orthologs. The predicted signal peptides (SP), LTP domain, extensin-like motif (EXT), and GPI anchor are indicated as cyan, pink, blue, and purple boxes, respectively. Numbers indicate sequence length (amino acids).
(E) RT-qPCR analysis of relative EPAD1 transcript levels in various tissues. St, anther stage; 5 DAP, seeds 5 d after pollination. Error bars indicate SDs from three biological replicates.
(F) to (M) mRNA in situ hybridization for EPAD1 in stage 5 (F), stage 6 (G), stage 7 (H), stage 8a (I), stage 8b (J), and stage 9 (K) anthers. Sp, sporogenous cell; MMC, microspore mother cell; MC, meiotic cell; Tds, tetrads; Msp, microspore; T, tapetum. Sense probe was used as negative control ([L] and [M]). At least six biological replicates were used for anti-sense and sense probes signal analysis at each stage (stages 5–9). Representative images are shown. Bars = 20 µm.

