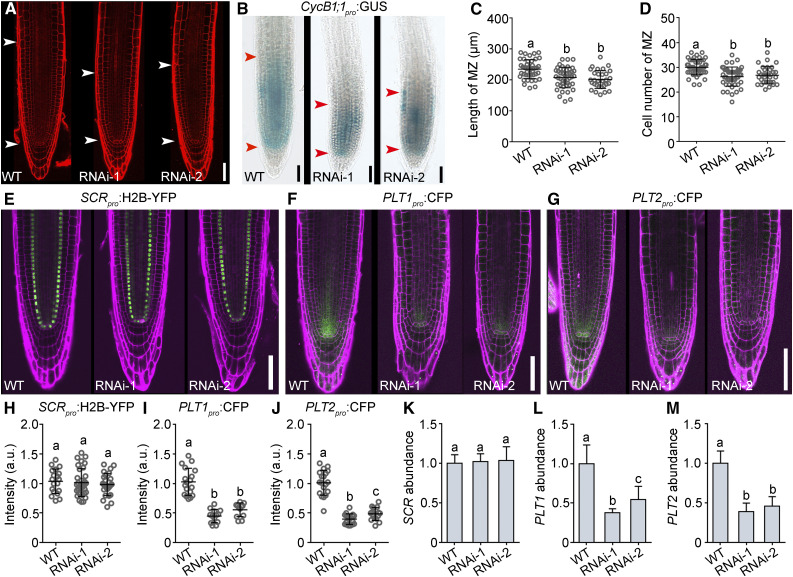
Figure 3.
JANUS Positively Regulates Root Meristem Activity.
(A) Representative CLSM image of PI-stained roots from the wild type and two 35Spro:JANUS-RNAi lines (RNAi-1 and RNAi-2).
(B) CycB1;1pro:GUS activity in roots from the wild type and two 35Spro:JANUS-RNAi lines.
The region of the RAM is indicated by two arrowheads in (A) and (B).
(C) and (D) Length (C) and cell number (D) of the root meristem zone (MZ). Values are means ± sd (n > 33).
(E) to (J) Representative CSLM images ([E] to [G]) and fluorescence intensities ([H] to [J]) of SCRpro:H2B-YFP ([E] and [H]), PLT1pro:CFP ([F] and [I]), and PLT2pro:CFP ([G] and [J]) in the wild type and two 35Spro:JANUS-RNAi lines. a.u. indicates arbitrary units. Roots were stained with PI (magenta). Values are means ± sd (n > 12) for (I) and (J) and means ± se (n = 27) for (H). Fluorescence of the stem cell niche from more than 12 roots was measured for (I) and (J); fluorescence of nuclei from 27 roots was measured for (H).
(K) to (M) Relative transcript abundance of SCR (K), PLT1 (L), and PLT2 (M) at 5 DAG in the wild type and two lines of 35Spro:JANUS-RNAi by RT-qPCR. Values are means ± se (n = 3).
Different letters in (C), (D), and (H) to (M) indicate significantly different groups (one-way ANOVA, Tukey’s multiple comparisons test, P < 0.05). Bars in (A), (B), and (E) to (G) = 50 μm.

