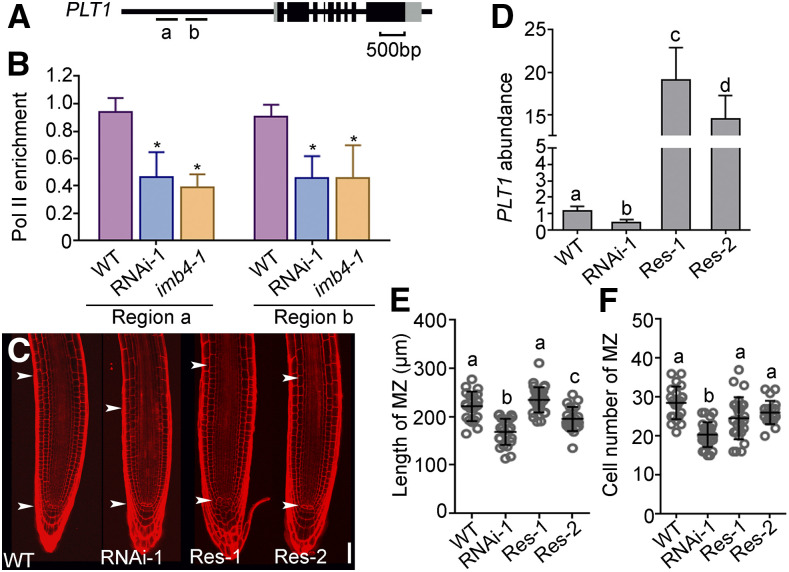
Figure 4.
JANUS Mediates Pol II-Dependent PLT1 Transcription.
(A) Schematic illustration of the PLT1 genomic locus. Letters (a and b) indicate target regions in ChIP-PCR.
(B) Quantification of ChIP-PCR. Pol II enrichment at PLT1 is presented as the ratio of PLT1 (Pol II/input) to ACTIN (Pol II/input). Results are means ± se (n = 3). Asterisks indicate significant differences from the wild type (t test, P < 0.05).
(C) Representative PI-stained roots from the wild type, 35Spro:JANUS-RNAi-1, and two 35Spro:JANUS-RNAi UBQ10pro:GFP-PLT1 lines (Res-1 and Res-2). The region of the RAM is indicated by two arrowheads. Bar = 50 μm.
(D) Relative transcript abundance of PLT1 in the wild type, 35Spro:JANUS-RNAi-1, and two lines of 35Spro:JANUS-RNAi-1 UBQ10pro:GFP-PLT1 (Res-1 and Res-2). Values are means ± se (n = 3). RNAs were extracted from seedlings at 5 DAG.
(E) and (F) Length (E) and cell number (F) of the root meristem zone (MZ). Values are means ± sd (n > 17).
Different letters in (D) to (F) indicate significantly different groups (one-way ANOVA, Tukey’s multiple comparisons test, P < 0.05).

