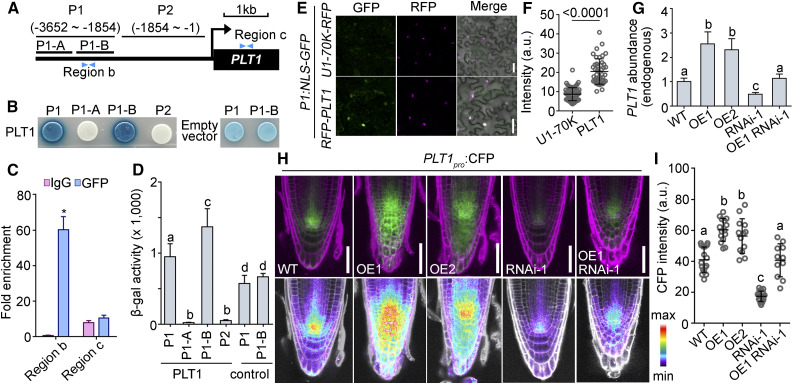
Figure 7.
Autotranscriptional Regulation of PLT1 in RAM Requires JANUS.
(A) Schematic illustration of the promoter and 5′ untranslated region of PLT1. P1-A spans from –3652 to –2809 bp; P1-B spans from –2809 to –1854 bp; region b spans from –2047 to –1919 bp; region c spans from 726 to 1103 bp.
(B) Representative Y1H assay. Empty vector used as the negative control shows background activation to the P1 and P1-B regions.
(C) Quantification of ChIP-PCR. Fold enrichment at PLT1 is presented as the ratio of PLT1 (ChIP/input) to ACTIN (ChIP/input). Results are means ± se (n = 3). Seedlings at 5 DAG were used for the assay. The asterisk indicates a significant difference from the wild type (t test, P < 0.05).
(D) β-Galactosidase activity from Y1H assays. Control indicates empty vector. Values are means ± sd (n = 7). Different letters indicate significantly different groups (one-way ANOVA, Tukey’s multiple comparisons test, P < 0.05).
(E) and (F) Representative CLSM images (E) and GFP intensities (F) of leaf epidermal cells cotransformed with P1pro:NLS-GFP and 35Spro:RFP‐PLT1 (magenta) or U1pro-70K-RFP (a nuclear protein as a control; magenta). a.u. indicates arbitrary units. Results are means ± sd (n > 30). The P value is shown on top of the bar graph (t test). Bars = 50 μm.
(G) to (I) Endogenous PLT1 abundance (G), CLSM images (H), and CFP intensities (I) of the PLT1pro:CFP reporter in the wild type Col-0, two UBQ10pro:GFP-PLT1 lines (OE1 and OE2), 35Spro:JANUS-RNAi (RNAi-1), and 35Spro:JANUS-RNAi UBQ10pro:GFP-PLT1 (OE1 RNAi-1). The same PLT1pro:CFP transgene was used in all genetic backgrounds. Images in the top row are merges of the CFP and RFP channels (PI; magenta); images in the bottom row are the CFP channel in pseudocolors, for which intensities cover the full range of measured values within each data set (maximum to minimum). Values in (G) are means ± se (n = 3). RNAs were extracted from seedlings at 5 DAG. Values in (I) are means ± sd (n > 20). Fluorescence of the stem cell niche was measured. Different letters indicate significantly different groups (Tukey’s multiple comparisons test, P < 0.05). Bars = 50 μm.

