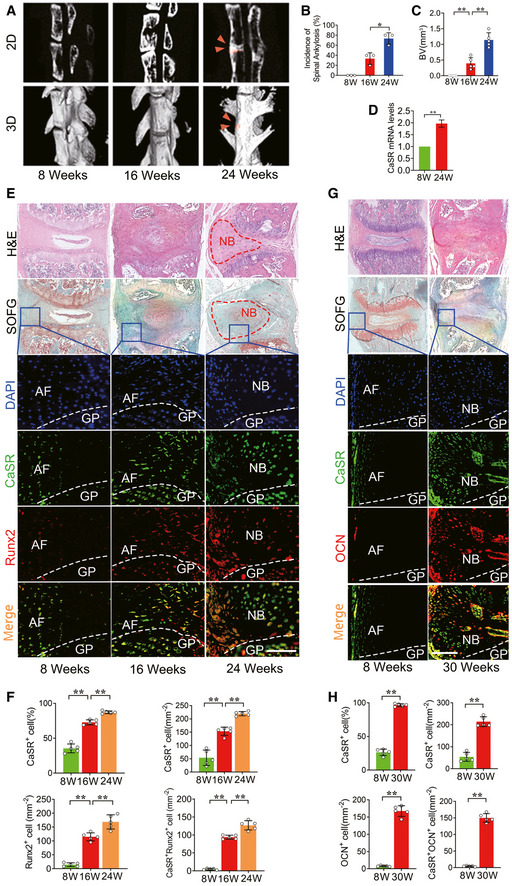
Figure 2. CaSR+ osteoblasts mediate new bone formation in PGIS model.

- μCT images of the spine in PGIS model (2D and 3D reconstruction). Arrow head shows spinal ankylosis. n = 5 per group. μCT images of new bone (red area) in hind paws (2D and 3D reconstruction) in DBA/1 model compared to baseline.
- Incidence of spinal ankylosis in PGIS model. n = 5 per cage of total 3 cages per group, Fisher’s exact test.
- Quantitative analysis of structural parameters of spinal ankylosis by μCT analysis. n = 5 per group, one‐way ANOVA, Bonferroni post hoc.
- RT–qPCR analysis of expression of CaSR in spinal ligament tissue. n = 3, Student’s t‐test.
- H&E, SOFG and Immunofluorescence analyses of the spine specimen of PGIS model compare to baseline. n = 5 per group.
- Quantitative analysis of CaSR+, Runx2+ and CaSR+ Runx2+ cells number and CaSR+ cell percentage in the spine specimen of PGIS model. n = 5 per group, one‐way ANOVA, Bonferroni post hoc.
- H&E, SOFG and immunofluorescence analyses of the spine specimen of PGIS model at 30 weeks compared to baseline. GP: Growth plate. n = 5 per group.
- Quantitative analysis of CaSR+, OCN+ and CaSR+ OCN+ cells number in the spine specimen of PGIS model. n = 5 per group, one‐way ANOVA, Bonferroni post hoc.
Data information: AF: Annulus fibrosus; GP: Growth plate; NB: New bone. Data shown as mean ± SD. **P < 0.01 compared between groups. Scale bar: 100 μm.
