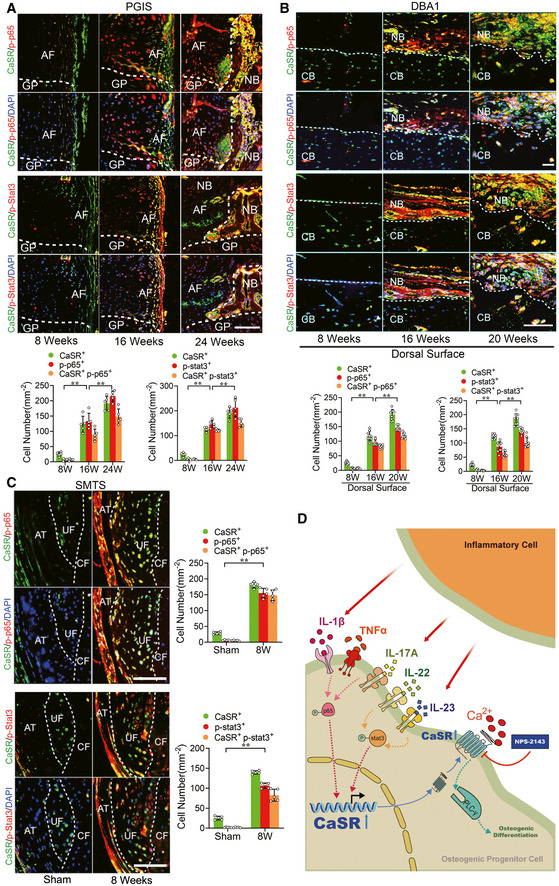
Figure 7. Inflammatory signalling pathways are activated in osteogenic precursor cells in AS animal models.

- Immunofluorescence analysis of spine in PGIS mice. Quantitative analysis of CaSR+ p‐p65+ cells and CaSR+ p‐Stat3+ cells number in pathological new bone formation of PGIS model. n = 5, one‐way ANOVA, Bonferroni post hoc.
- Immunofluorescence analysis of pathological new bone of hind paws in DBA/1 mice. Quantitative analysis of CaSR+ p‐p65+ cells and CaSR+ p‐Stat3+ cells number in pathological new bone formation sites. n = 9, one‐way ANOVA, Bonferroni post hoc.
- Immunofluorescence analysis of Achilles tendon enthesis compartment in SMTS model. Quantitative analysis of CaSR+ p‐p65+ cells and CaSR+ p‐stat3+ cells number in PCT. n = 5, Student’s t‐test.
- Schematic presentation of multiple inflammatory cytokines from inflammatory cell upregulate hyperstimulation of CaSR through NF‐κB/p65 and JAK/Stat3 pathways. Hyperstimulation of CaSR induce osteogenic differentiation through PLCγ signalling pathway in osteogenic precursor cell to promote pathological new bone formation in AS.
Data information: AF: Annulus fibrosus; GP: Growth plate; CB: Cortical bone; NB: New bone; UF: Uncalcified fibrocartilage; CF: Calcified fibrocartilage; PCT: posterior calcaneal tuberosity. Data shown as mean ± SD. **P < 0.01 compared between groups. Scale bar: 100 μm.
