
Figure EV3. Correlation between CSF and plasma N‐p‐tau181.
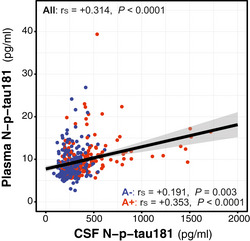
N‐p‐tau181 was measured with the same assay in matched CSF and plasma samples. Scatter plots depicting the correlations between the CSF. We computed the Spearman's correlation coefficient (r s) and the P‐value for the whole cohort (n = 381) and for the A− (n = 250; blue dots) and A+ (n = 131; red dots) groups. The solid lines indicate the regression line and the 95% confidence intervals. Abbreviations: CSF, cerebrospinal fluid; N, N‐terminal; p‐tau, phosphorylated tau.