
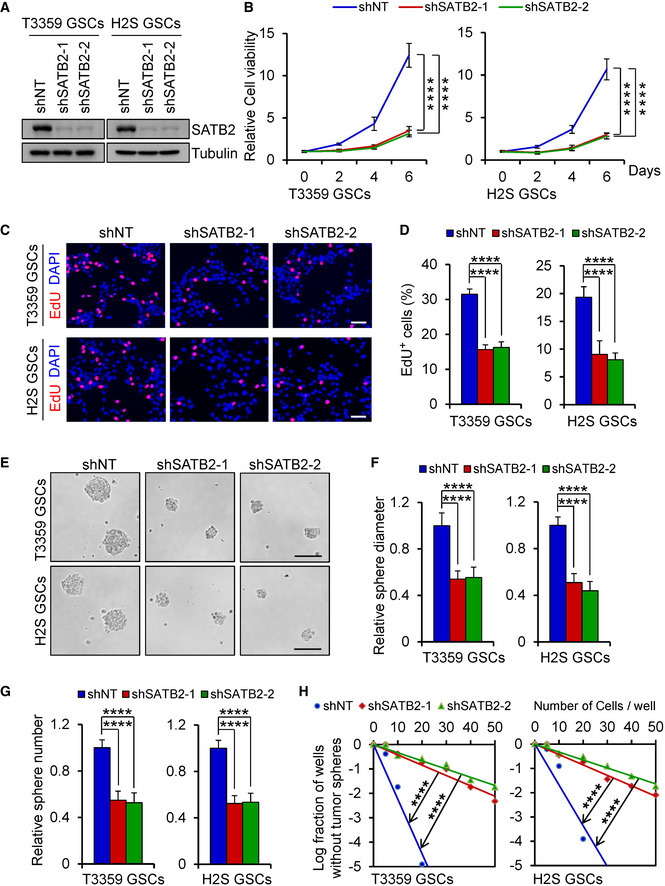
Figure 2. Disrupting SATB2 impaired GSC proliferation and self‐renewal.
-
AImmunoblot analysis of SATB2 expression in GSCs transduced with lentiviral‐mediated non‐targeting shRNA (shNT) or SATB2 shRNA (shSATB2).
-
BCell viability of GSCs transduced with shNT or shSATB2 (n = 5).
-
CEdU incorporation assay of GSCs transduced with shNT or shSATB2. Scale bar: 50 μm.
-
DQuantification of (C) showing the percentage of EdU+ cells (n = 5).
-
ETumorsphere images of GSCs transduced with shNT or shSATB2. Scale bar: 100 μm.
-
F, GQuantification of the diameter (F) or number (G) of tumorspheres formed by GSCs expressing shNT or shSATB2 (F: n = 9; G: n = 5).
-
HIn vitro limiting dilution analysis of the tumorsphere formations of GSCs expressing shNT or shSATB2. Silencing SATB2 attenuated the self‐renewal capacity of GSCs.
Data information: Data are represented as mean ± SD. ****P < 0.0001, two‐way ANOVA analysis followed by Tukey’s test (B), one‐way ANOVA analysis followed by Tukey’s test (D, F, and G) or ELDA analysis for differences in stem cell frequencies (H). Exact P values are reported in Appendix Table S3.