
Figure 2. Monitoring Tau seeding.
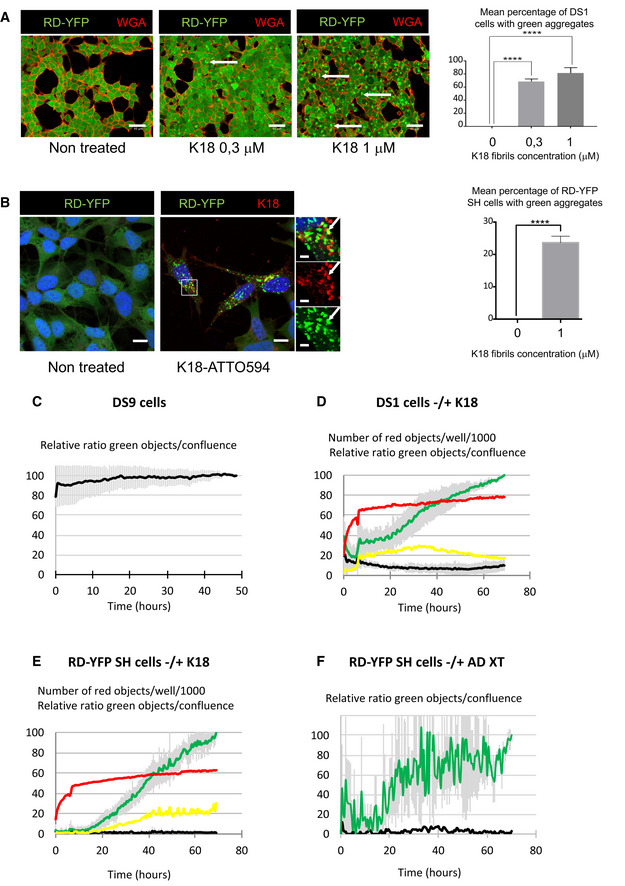
- Representative confocal images of DS1 cells (expressing soluble Tau RD‐YFP), non‐treated and treated with increasing concentrations of non‐labeled K18 fibrils, fixed after 2 days, and stained with WGA‐Alexa 594 (red). The arrows point to examples of aggregate‐containing cells; scale bars are 40 μm. On the right is the quantification of the mean percentage + SEM of cells where green aggregates were detected (the total number of cells analyzed over three independent experiments was 1,188 for non‐treated, 1,552 for 0.3 μM, and 1,506 for 1 μM), with statistical analysis by one‐way ANOVA and Bonferroni's post hoc test (****P = 6.20E−06 and 6.74E−05 for 0–0.3 and 0–1 comparisons, respectively).
- Representative confocal images (40×) of RD‐YFP SH cells, non‐treated and treated with 1 μM K18‐ATTO 594 fibrils, 48 h after fibril addition. Right insets are threefold enlargements of the boxed region of treated cells, merge and single‐channel pictures; white arrows point to partial colocalization. Scale bars are 10, 2 μm in the insets. On the right is the quantification of the mean percentage (24%) + SD of cells where green aggregates were detected (2,874 treated cells analyzed over six independent experiments), with statistical analysis by two‐tailed unpaired t‐test (****P = 3.75E‐07).
- Relative proportion of DS9 cells expressing aggregates of Tau RD‐YFP over a 50‐h period monitored by IncuCyte. DS9 cells were left untreated, and the graph represents means of three independent experiments ± SD. See also Movie EV1.
- Monitoring the conversion of DS1 cells into inclusion‐containing cells over a 70‐h period upon treatment with K18 fibrils. Cells were plated, treated or not with K18‐ATTO 594 fibrils at 1 μM (time 0), and placed into the IncuCyte incubator for 6 h and next kept in culture for an additional 60 h after medium change. The scatter plot represents means of five independent experiments (± SD for green and black curves). See also Movie EV2.
- Monitoring the conversion of RD‐YFP‐expressing SH‐SY5Y cells into inclusion‐containing cells over a 70‐h period upon treatment with K18 fibrils. Experiment and analysis were performed as in (D), and the scatter plot shows means of three independent experiments ± SD for the green and black curves. See also Movie EV3.
- Monitoring the conversion of RD‐YFP‐expressing SH‐SY5Y cells into inclusion‐containing cells over a 70‐h period upon treatment with a cortex crude extracts from a AD‐deceased patient. Experiment and analysis were performed as in (D), and the scatter plot shows means of two independent experiments ± SD for the green curve. See also Movies EV4 and EV5. IncuCyte (20× objective) was set to acquire images every 30 min, and phase‐contrast and green channels (excitation 440–480 nm, 400 ms) were acquired (nine images/well). Analysis was performed with IncuCyte software as in (C–E) to give the relative proportion of cells being converted to inclusion‐containing cells (the end point of treated cells was arbitrarily set at 100%, black curve: non‐treated cells, green curve: treated cells).
Data information: For (C–E), IncuCyte (20× objective) was set to acquire images every 30 min, and phase‐contrast and green channels (excitation 440–480 nm, 400 ms) and red (excitation 565–605 nm, 800 ms) channels were acquired (four images/well, two wells/condition). Analysis was performed with IncuCyte software to quantify the number of red objects (K18‐ATTO 594 fibrils, red curve: treated cells); the relative ratio between green objects and confluence, giving the relative proportion of cells being converted to inclusion‐containing cells (the end point of treated cells was arbitrarily set at 100%, black curve: non‐treated cells, green curve: treated cells); the relative ratio of green and red‐colocalized objects over confluence (yellow curve: treated cells).