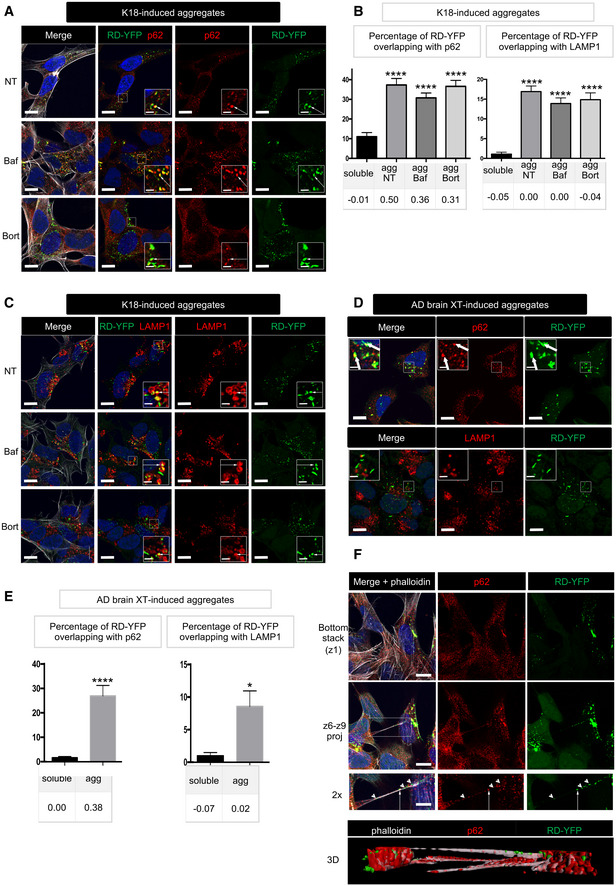
RD‐YFP SH cells were challenged with non‐labeled K18 fibrils, incubated 2 days later with bafilomycin A1 (second line of panels), bortezomide (bottom panels), or left non‐treated (NT, upper panels) for 4 h before fixation, saponin permeabilization, and staining with antibody recognizing p62 (red) and WGA (white in left panels). Images are confocal pictures after deconvolution (63×, zoom 1.8, px size = 60 nm, slice of 0.43 μm) representative of three independent experiments. Insets are threefold enlargements of the boxed regions of second column; white arrows point to colabeling; scale bars are 10, 2 μm in insets.
Quantification of colocalization of RD‐YFP material with p62‐positive structures (left graph) or LAMP1‐positive vesicles (right) upon K18 fibril‐induced aggregation. Confocal pictures were analyzed in 3D with Imaris software from pictures obtained as in (A), and the graphs represent the mean percentage (+ SEM) of green material overlapping with p62 or LAMP1: aggregates if cells have been converted (agg) or soluble material otherwise. Below each graph, the corresponding Pearson's correlation coefficient (PCC) is indicated. The number of cells analyzed over two independent experiments is 40, 51, 63, and 34 for each respective condition for p62, 36, 59, 44, and 27 for LAMP1. Statistically significant differences were then compared to the soluble conditions (one‐way ANOVA and Tukey post hoc test [****P = 1.33E‐17, 2.57E‐18, and 2.05E‐20, respectively, for p62, 3.44E‐16, 1.21E‐13, and 1.24E‐13 for LAMP1]). Note that the differences between agg NT, BafA1, and Bort were not significant neither for percentage of overlapping nor for PCC, with both p62 and LAMP1.
As in (A), except that anti‐LAMP1 antibody was used; scale bars are 10, 2 μm in the insets.
RD‐YFP SH cells were challenged with AD‐derived brain extracts, trypsinized, and replated 3 days later for an additional 24h before fixation, saponin permeabilization, and staining with antibody recognizing p62 or LAMP1 (in red). Images are confocal pictures (63×, zoom 1.6, px size = 60 nm, slice of 0.43 μm) representative of two independent experiments. Insets are threefold enlargements of the boxed regions; white arrows point to colabeling; scale bars are 10, 2 μm in the insets.
Quantification of colocalization of RD‐YFP material with p62‐positive structures (left graph) or LAMP1‐positive vesicles (right) upon AD extract‐induced aggregation. Confocal pictures were analyzed in 3D with Imaris software from pictures obtained as in (D), and the graphs represent the mean percentage (+ SEM) of green material overlapping with p62 or LAMP1: aggregates if cells have been converted (agg) or soluble material otherwise. Below each graph, the corresponding Pearson's correlation coefficient (PCC) is indicated. The number of cells analyzed over two independent experiments is 21 (sol) and 27 (agg) for p62, and 12 (sol) and 17 (agg) for LAMP1. Statistically significant differences were then compared to the soluble conditions (two‐tailed t‐test, ****P = 5.62E‐06, *P = 0.013).
Confocal pictures of RD‐YFP cells, treated with bortezomide and labeled as in (A), except that phalloidin‐Texas Red was incubated together with the secondary Alexa 647 antibody. Upper panels are the bottom slice corresponding to the substrate‐attached surface of cells (z1), and below are projections of slices 6–9 of the same pictures (z6–z9, not attached to the substrate). Below is a twofold magnification of the area framed in the merged projection, showing a TNT. White arrows point to overlapping between RD‐YFP aggregates and p62, and arrowheads to aggregates not colocalizing with p62 inside the TNT; scale bars are 10, 5 μm in the insets. Bottom is a 3D reconstruction (using Imaris software) of the same region.