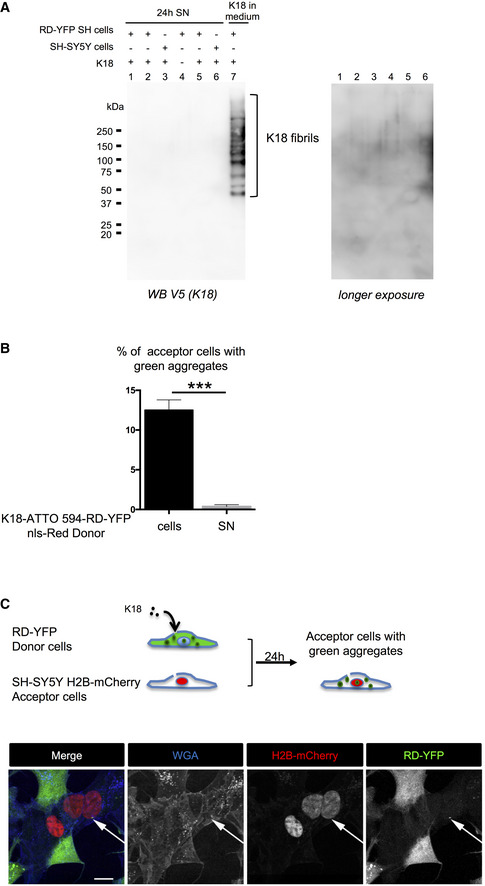
Figure EV4. Transfer of RD‐YFP aggregates in SH‐SY5Y derived cells.

- Conditioned medium of cells treated with K18 fibrils is devoid of K18 fibrils. Twenty‐four‐hour conditioned media (1 ml) of cells (SH‐SY5Y or RD‐YFP SH) treated or not with K18 as indicated, providing from independent experiments, were ultracentrifuged at 100,000 g for 1 h at 4°C. Pellets containing insoluble material were solubilized in 1% SDS‐containing Laemmli without reducing agent and analyzed by WB for the presence of K18 (detected with anti‐V5 antibody). As positive control, the same volume of fibril‐containing medium, collected at the end of the 6‐h incubation on cells (i.e., containing fibrils that were not uptaken by cells), was processed the same way (lane 7). The K18 ladder corresponding to the fibrils is indicated by brackets. Right is overexposure of the lanes 1–6 of the membrane.
- Quantification of the percentage of RD‐YFP SH acceptor cells with insoluble RD‐YFP, depending on the condition (12.5% for donor cells and 0.37% for donor SN) in the experiment described in Fig 4C. Analysis was performed using ICY software, and data represent the number of aggregate‐containing cells over the total number of green cells without red nuclei + SEM (the total number of acceptor cells analyzed over two independent experiments was 1,788 for coculture and 1,028 for SN) with statistical analysis by two‐tailed unpaired t‐test (***P = 0.0006).
- Visualization of the direct transfer of endogenously formed RD‐YFP aggregates to SH‐SY5Y cells. Above the pictures is a schematic representation of the experiment. Donor RD‐YFP SH cells expressing aggregates obtained 2 days after treatment with non‐labeled K18 fibrils were cocultured for 24 h with SH‐SY5Y cells first transfected with H2B‐mCherry expression vector. The images are Z‐stack projections covering nine slices (each 0.43 μm), and similar experiments were performed three times. Transferred RD‐YFP aggregate is indicated by the white arrow, and single‐channel pictures are grayscale images; and scale bar is 10 μm.
