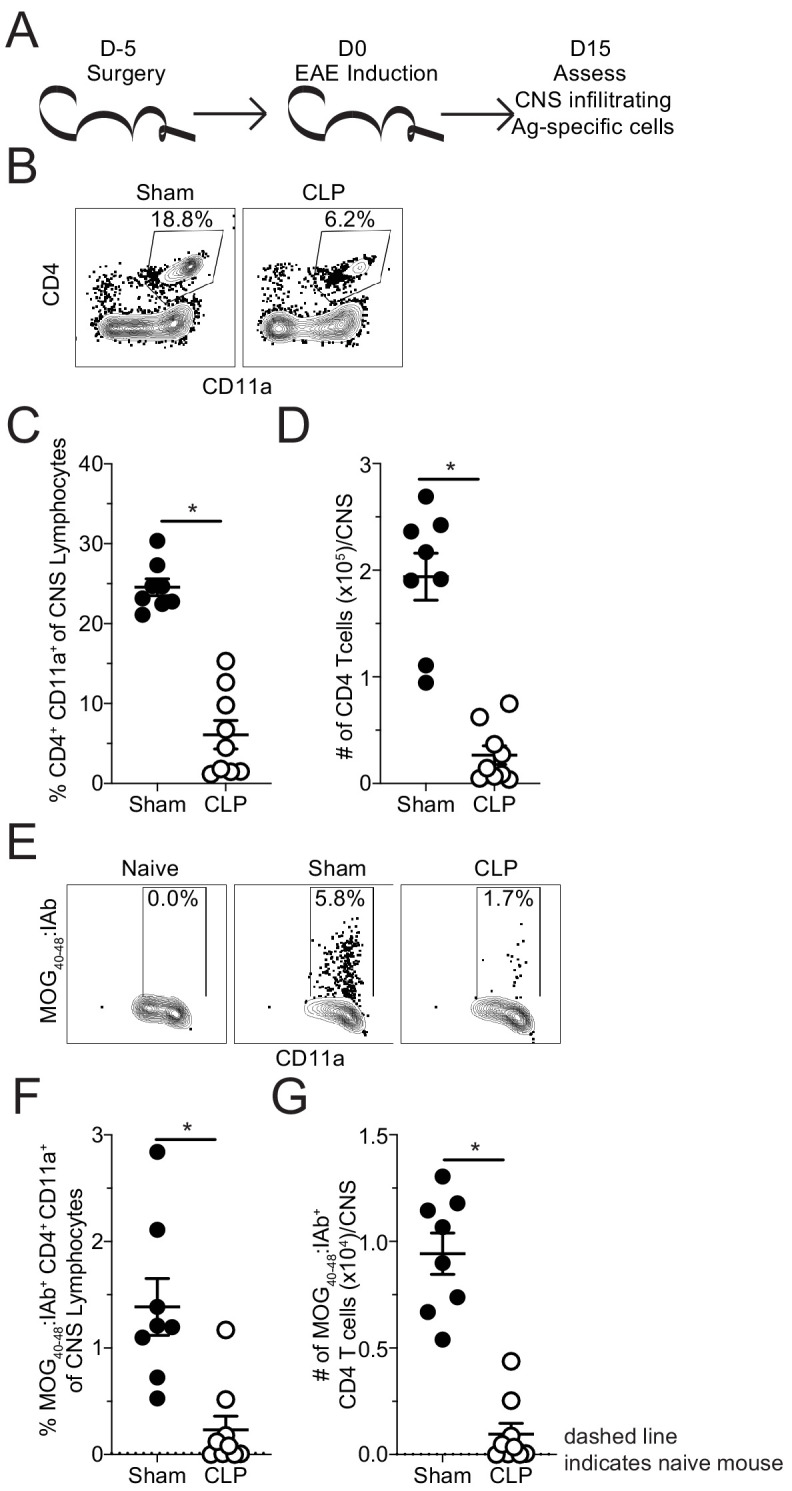
Figure 2. Fewer MOG-specific CD4 T cells are present in the CNS of CLP mice.

(A) Experimental design: C57Bl/6 mice underwent either sham or CLP surgery. EAE induction occurred 5 days after surgery. Mice were perfused 15 days post-EAE induction and CNS was harvested. (B) Representative flow plots for CNS CD4 T cells, gated on lymphocytes, from sham and CLP mice. (C) Frequency and (D) number of CNS CD4 T cells in sham and CLP mice. (E) Representative flow plots for CNS MOG-specific CD4 T cells, gated on total CD4 T cells, from Naive (staining control), sham, and CLP mice. (F) Frequency and (G) number of CNS MOG-specific CD4 T cells in sham and CLP mice. Dashed line indicates staining and number from naive control mouse. Data are representative from two independent experiments with 8–10 mice per group. *p<0.05. Error bars represent the standard error of the mean.
