. 2020 Nov 16;9:e55800. doi: 10.7554/eLife.55800

Figure 6. Sepsis reduces the number of MOG-specific CD4 T cells but not their capacity to proliferate.

(A) Experimental design: Thy1.2 C57Bl/6 mice were separated into Pre- and Post-transfer groups. The Pre-transfer group received 5 × 10³ naive Thy1.1 2D2 TCR-Tg CD4 T cells 1 day before sham or CLP surgery. The Post-transfer group underwent sham or CLP surgery then received 5 × 10³ naive Thy1.1 2D2 TCR-Tg CD4 T cells 4 days later. EAE was induced in both the Pre- and Post-transfer groups 5 days after surgery (Pre: 6 days post 2D2 T cell transfer; Post: 1 day post 2D2 T cell transfer). iLN were harvested 7 days after the transfer. (B) Representative gating strategy for identifying transferred 2D2 TCR-Tg CD4 T cells, their expression of the proliferation marker Ki67, and markers of apoptosis (activated caspase3/7 with propidium iodide) from sham and CLP mice. (C) Number of transferred 2D2 TCR-Tg CD4 T cells in the iLN of sham and CLP mice. (D) Frequency of 2D2 TCR-Tg CD4 T cells expressing Ki67. (D) Frequency of apoptotic (FLICA+ PI+) 2D2 TCR-Tg CD4 T cells. Data are representative from two independent experiments with four to five mice per group. *p<0.05. Error bars represent the standard error of the mean.

Figure 6—source data 1. Source data for Figure 6B–D.
Figure 6—source data 2. Source data for Figure 6B,E.

Figure 6.

Figure 6—figure supplement 1. Sepsis does not influence the expression of Fas, FasL, and TRAIL by autoantigen-specific T cells.

Figure 6—figure supplement 1.

Thy1.2 C57Bl/6 mice were separated into Pre- and Post-transfer groups. The Pre-transfer group received 5 × 10³ naive Thy1.1 2D2 TCR-Tg CD4 T cells 1 day before sham or CLP surgery. The Post-transfer group underwent sham or CLP surgery then received 5 × 10³ naive Thy1.1 2D2 TCR-Tg CD4 T cells 4 days later. EAE was induced in both the Pre- and Post-transfer groups 5 days after surgery (Pre: 6 days post 2D2 T cell transfer; Post: 1 day post 2D2 T cell transfer). iLN were harvested 7 days after the transfer. (A) Representative gating of Fas, FasL, and TRAIL expression by 2D2 CD4s. Frequency (B) and number (C) of Fas, FasL, and TRAIL expressing cells in the pre-transfer group. Frequency (D) and number (E) of Fas, FasL, and TRAIL expressing cells in the post-transfer group. Data are from 1 experiment with five mice per group. *p<0.05. Error bars represent the standard error of the mean.
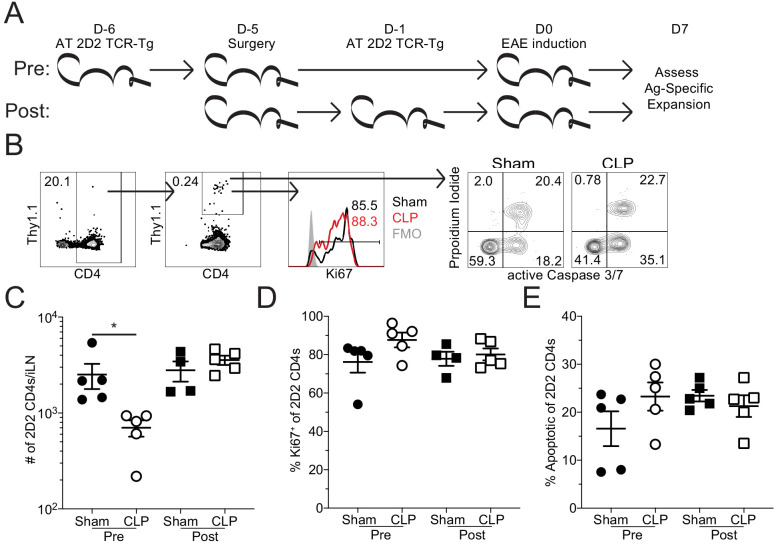
Figure 6—figure supplement 1—source data 1. Source data for Figure 6—figure supplement 1.
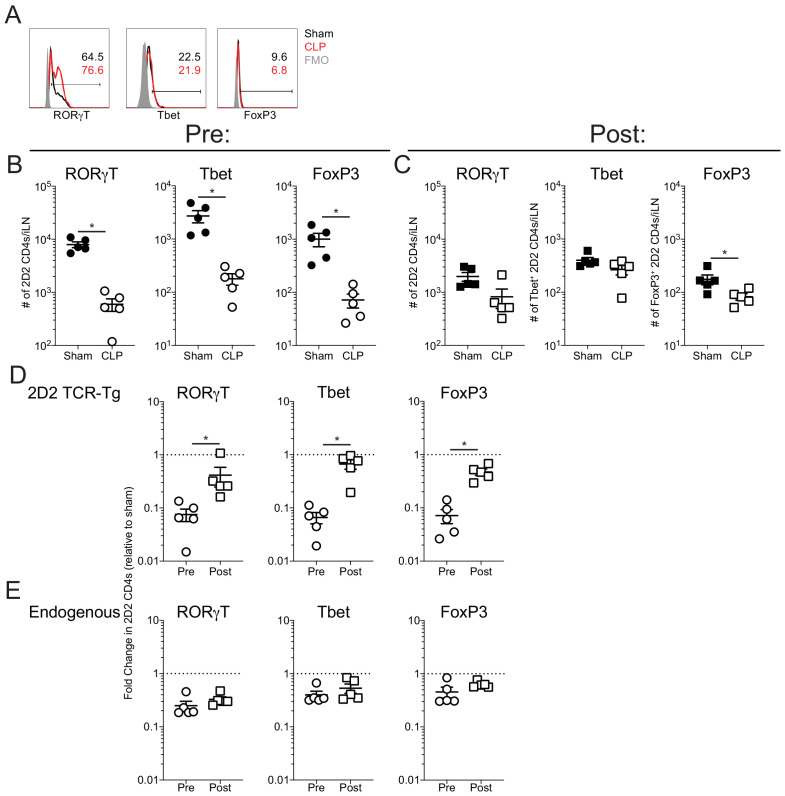
Figure 6—figure supplement 2. Sepsis does not influence the expression of RORγT, Tbet, and FoxP3 by autoantigen-specific T cells.

Figure 6—figure supplement 2.

Thy1.2 C57Bl/6 mice were separated into Pre- and Post-transfer groups. The Pre-transfer group received 5 × 10³ naive Thy1.1 2D2 TCR-Tg CD4 T cells 1 day before sham or CLP surgery. The Post-transfer group underwent sham or CLP surgery then received 5 × 10³ naive Thy1.1 2D2 TCR-Tg CD4 T cells 4 days later. EAE was induced in both the Pre- and Post-transfer groups 5 days after surgery (Pre: 6 days post 2D2 T cell transfer; Post: 1 day post 2D2 T cell transfer). iLN were harvested 7 days after the transfer. (A) Representative gating of RORγT, Tbet, and FoxP3 expression by 2D2 CD4s. Number of RORγT, Tbet, and FoxP3 2D2 CD4 T cells in pre- (B) and post-transfer (C) groups. Fold change in the number of RORγT, Tbet, and FoxP3 (D) 2D2 CD4 T cells and (E) endogenous CD4 T cells relative to sham controls in the pre- and post-transfer groups. Data are from 1 experiment with five mice per group. *p<0.05. Error bars represent the standard error of the mean.
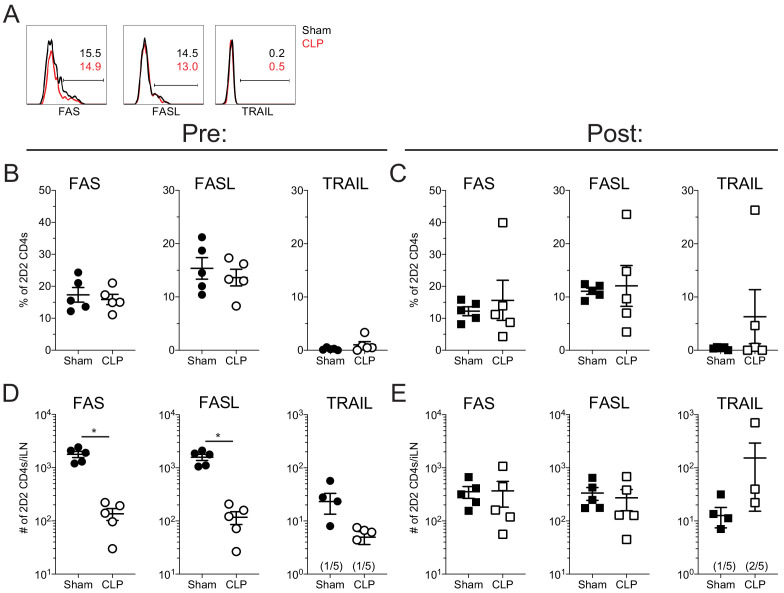
Figure 6—figure supplement 2—source data 1. Source data for Figure 6—figure supplement 2.