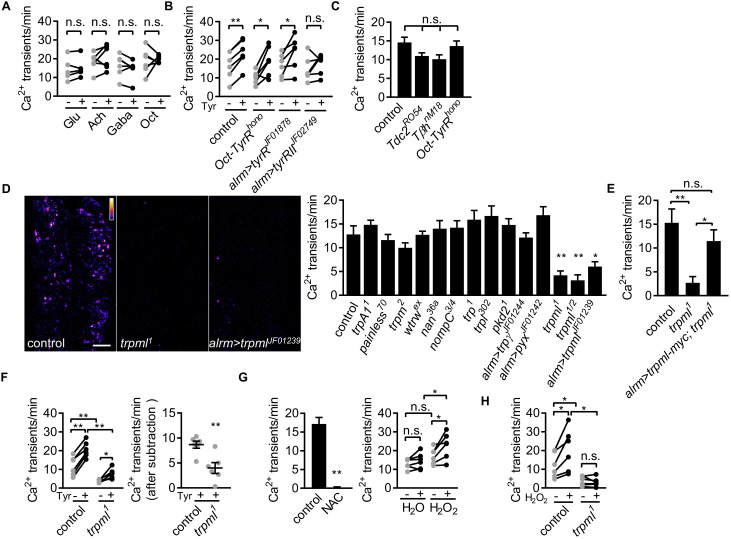
Figure 2. Astrocyte microdomain Ca2+ transients are genetically distinct from soma transients and require TrpML.
(A) Responses of microdomain Ca2+ transients (frequency) to glutamate (Glu), acetylcholine (Ach), γ-aminobutyric acid (Gaba), tyramine (Tyr), octopamine (Oct) in presence of tetrodotoxin. (B) Effect of tyramine on Ca2+ transient frequency in genotypes indicated. Oct-TyrR mutants, and astrocyte-specific (alrm>) expression of RNAis to TyrR or TyrRII (in A and B, n = 6, mean ± SEM, paired t-test). (C) Quantification of microdomain Ca2+ transients in Tdc2RO54, TβhnM18 or Oct-TyrRhono mutants (n = 6, mean ± SEM, one-way ANOVA). (D) Maximally projected astrocyte microdomain Ca2+ transients during 6 min in control, trpml1 mutants, and astrocyte-specific trpmlRNAi (in pseudocolor, grayscale values ranging from 0 to 255. scale bar, 20 µm). Quantification of microdomain Ca2+ transients in mutants (loss-of-function mutations or astrocyte-specific RNAi driven by alrm-Gal4) of genes encoding TRP family ion channels (n = 6, mean ± SEM, one-way ANOVA). (E) trpml-myc expression in astrocytes rescues microdomain Ca2+ transients in trpml1 mutants (n = 6, mean ± SEM, one-way ANOVA). (F) Effect of tyramine treatment on controls and trpml1 mutants (n = 6, mean ± SEM, one-way ANOVA. within groups, paired t-test). Right panel, increase in transients by tyramine (subtracting the basal included) in control and trpml1 mutants. (G) Application of the antioxidant N-acetyl cysteine (NAC) or H2O2 to the larval CNS. (for F and G n = 6, mean ± SEM, across groups, one-way ANOVA; within groups, paired t-test; -, + indicate pre-, post-delivery). (H) H2O2 application to control and trpml mutants shows that H2O2-dependent increases require TrpML. See source data Figure 2—source data 1.


