. 2020 Oct 22;9:e59716. doi: 10.7554/eLife.59716

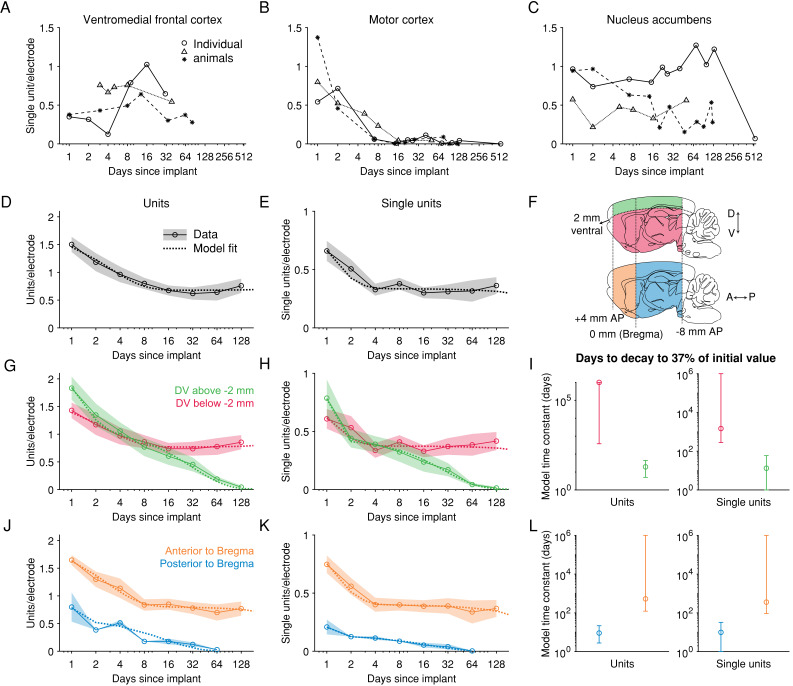
Figure 4. After an initial loss of units, spiking signals can be maintained >60 days in anterior, deeper brain regions.

(A) Recordings from the medial prefrontal cortex (encompassing the areas labelled in the Paxinos Brain Atlas as prelimbic cortex and medial orbital cortex) across three example animals. Each combination of marker and line types indicates one animal. (B) Recordings from motor cortex. (C) Recordings from nucleus accumbens. (D) The number of units recorded per electrode per session. Shading represents mean +/- 1 s.e.m. across recording sessions. The dashed line is the fit of a sum of two exponential decay terms, representing two subpopulations with different time constants of decay. (E) The number of single units. (F) To explore the dependence of signal stability on anatomical position, units were separated into two groups along either the dorsoventral (DV) axis or the anteroposterior (AP) axis. (G) The number of units recorded either more superficial to or deeper than 2 mm below the brain surface, normalized by the number of electrodes in the same region. (H) Similar to G, but showing the number of single units. (I) The model time constant is the inferred number of days after implantation when the count of units (or single units) declined to 1/e, or ~37%, of the count on the first day after implant. The 95% confidence intervals were computed by drawing 1000 bootstrap samples from the data. (J-L) Similar to G-I, but for data grouped according to their position along the anterior-posterior axis of the brain. (D-E) N = [12, 8, 20, 18, 32, 20, 13, 16] recording sessions for each bin. (G-H) DV [−10,–2] mm: N = [12, 8, 19, 18, 32, 20, 13, 16]; DV [−2, 0] mm: N = [6, 4, 11, 7, 14, 10, 8, 5]. (J-K) AP [−8, 0] mm: N = [2, 1, 5, 1, 8, 4, 1]; AP [0, 4] mm: N = [10, 7, 15, 17, 24, 16, 12, 16].

Figure 4.

Figure 4—figure supplement 1. Example histological images of probe tracks.

Figure 4—figure supplement 1.

(A) Four probes were implanted in the medial prefrontal cortex. The coordinates targeted (but not necessarily realized) were 4.0 mm anterior from Bregma, 1.0 mm lateral, and 4.2 mm deep, −10° in the coronal plane. (B) Two probes were implanted in anterior striatum and M2. The target coordinates were 1.9 mm anterior, 1.3 mm lateral, and 8.2 mm deep, and 15° in the coronal plane. (C) Four probes were implanted in M1 and anterior striatum. The target coordinates were 0.0 mm anterior, 2.4 mm lateral, 8.2 mm deep, and 15° in the sagittal plane. While the probe was tilted in the sagittal plane, histological slices were taken in the coronal plane. (D) Three probes were implanted in the midbrain with three different target coordinates: (1) 7.0 mm posterior, 3.0 mm lateral, and 5.8 mm deep. (2) 6.6 mm posterior, 1.6 mm lateral, and 7.8 mm deep, and −40° in the coronal plane. (3) 6.8 mm posterior, 1.7 mm lateral, and 8.0 mm deep, and −40° in the coronal plane. (A-D) Brain atlas was adapted from Paxinos and Watson, 2006. AcbC, accumbens nucleus, core. BIC, nucleus of the brachium of the inferior colliculus. Cg1, cingulate cortex, area 1. CPu, caudate putamen. ECIC, external cortex of the inferior colliculus. MO, medial orbital cortex. M1, primary motor cortex. M2, secondary motor cortex. PBG, parabigeminal nucleus. Post, postsubiculum. PrL, prelimbic cortex. RSD, retrosplenial dysgranular cortex. SC, superior colliculus. V1M, primary visual cortex, monocular. V2MM, secondary visual cortex, mediomedial. A positive angle in the coronal plane indicates that the probe tip was more lateral than the insertion site at the brain surface, and a positive angle in the sagittal plane indicates that the probe tip was more anterior than the insertion site.
Figure 4—figure supplement 2. Comparison of yields before and after manual curation.

Figure 4—figure supplement 2.

(A–B) Units and SUs (per electrode) identified by Kilosort2 before manual curation, shown as a function of time elapsed after implantation, for the subset of recording sessions that were manually curated (n = 25 sessions). Colors indicate sessions from the same implantations and banks. (C–D) Same data as in A,B after manual curation of the Kilosort2 output. Note the highly similar pattern of yield across sessions before and after manual curation. (E–F) Scatter plot directly comparing the yields (number of units or SUs per electrode) before and after manual curation. Nearly all points lie below the identity line but demonstrate a high degree of correlation, suggesting manual curation reduces the overall unit and SU number while having a minimal effect on the relative yields across sessions. Pearson r shown in these and subsequent plots, with a p-value reflecting a test of the null hypothesis of r = 0. (G–H) The ratio of units (and SUs) before versus after curation depends inversely on the number of units before curation. That is, a smaller fraction of units is removed (or in some cases, units are actually added) for sessions in which Kilosort2 identified a relatively small number of units. (I–J) The ratio of units (and SUs) before versus after curation depends weakly on the number of days elapsed since implantation, as would be expected given the relationship observed in G,H. This trend is non-significant, but suggests that curation could slightly alter the estimate of the time course of unit decline shown in Figure 4.
Figure 4—figure supplement 3. No degradation of spiking signals was detected over two months in rat medial prefrontal cortex (mPFC), the brain region in which the stability of spiking signals was examined in Jun et al., 2017.

Figure 4—figure supplement 3.

mPFC was recorded from four probes (one probe/animal, N = (2, 1, 6, 3, 4, 6, 4) sessions, implanted 4.0 mm anterior to Bregma, 1.0 mm lateral, 10° in the coronal plane at the probe tip relative to DV axis) and from the electrodes of those probes located in prelimbic cortex or medial orbital cortex, as according to probe tracks in histological slices and referenced to Paxinos and Watson, 2006. This finding contrasts with the clear signal degradation at all other recording sites. N = (12, 8, 20, 18, 32, 20, 13, 16). (A) The number of single units normalized by the number of electrodes in that brain region. (B) The number of single units. (C) The event rate. (D) The average peak-to-peak amplitude of waveforms.
Figure 4—figure supplement 4. The yield in single units over time for each brain area and each implant.

Figure 4—figure supplement 4.

Details about each implant can be found in Tables 1 and 2. Dorsomedial frontal cortex encompasses the areas named in the Paxinos and Watson brain atlas (Paxinos and Watson, 2006) as secondary motor cortex (M2) and cingulate cortex, area 1 (Cg1). Medial prefrontal cortex includes the areas prelimbic cortex (PrL) and medial orbital cortex (MO) in the atlas. Implants in both primary and motor cortices (M1 and M2) are grouped under ‘Motor cortex’. . Piriform areas include piriform cortex (Pir), dorsal endopiriform nucleus (DEn), and intermediate endopiriform nucleus (IEn). The amygdaloid body includes recording in anterior amygdaloid area (AA), anterior amygdaloid nucleus (ACo), lateral amygdaloid nucleus (dorsolateral region, LaDL), and basolateral amygdaloid nucleus (posterior region, BLP). Dorsal-posterior cortex includes recordings from primary visual cortex (monocular region, V1M) and retrosplenial granular cortex (region a, RSGa). The posterior tectum includes the external cortex of the inferior colliculus (ECIC) and the nucleus of the brachium of the inferior colliculus (BIC).
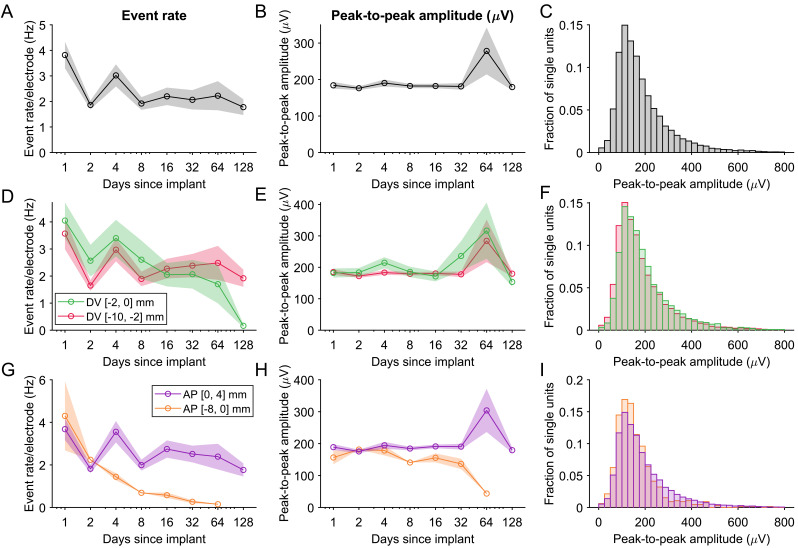
Figure 4—figure supplement 5. The event rate and peak-to-peak amplitudes.

Figure 4—figure supplement 5.

(A) The event rate (rate of all spikes across units). Shading represents mean +/- 1 s.e.m. across recording sessions. The transient increase in event rate in the time bin including days 3–5 is in part due to non-identical subsets of animals being included in different time bins, resulting in event rate variability due to differences in implanted brain region or arousal levels across animals. (B) The average peak-to-peak amplitude of the waveforms across single units. (C) The distribution of the peak-to-peak amplitude of all single units. (D–F) Event rate and peak-to-peak amplitude of units recorded either more superficial to or deeper than 2 mm below the brain surface, normalized by the number of electrodes in the same region. (G–I) Similar as (D–F), but for data grouped according to their position along the anterior-posterior axis of the brain.
Figure 4—figure supplement 6. Coefficient estimates of the sum-of-exponentials model used to describe unit loss over time.

Figure 4—figure supplement 6.

The model postulates that the number of units (N) across days after implant (t) depended on exponential decay from the unit count on the first day after surgery (N1). The term α is the fraction of the population whose exponential decay is parametrized by the change rate kfast, and the remaining fraction (1-α) decays with a slower (i.e. larger) time constant kslow. (A) The model time constant (𝜏model) is the inferred time when the unit count is 1/e of the initial value. Markers and error bar indicate mean +/- 1 s.e.m. Solid line indicates the model fit. (B) Fits to the number of units recorded either more superficial to (green) or deeper than (red) 2 mm below the brain surface. The p-value was computed from a two-tailed bootstrap test. For each parameter, the p-value indicates the probability of the observed difference in the estimate between the model fit to the superficial units and the model fit to the deeper units, under the null hypothesis that the distributions of unit counts from superficial and deeper electrodes are identical. (C) Same as B, but for the number of single units. (D) Fits to the number of units recorded either more anterior to (orange) or posterior to (blue) Bregma. (E) Same as D, but for single units.