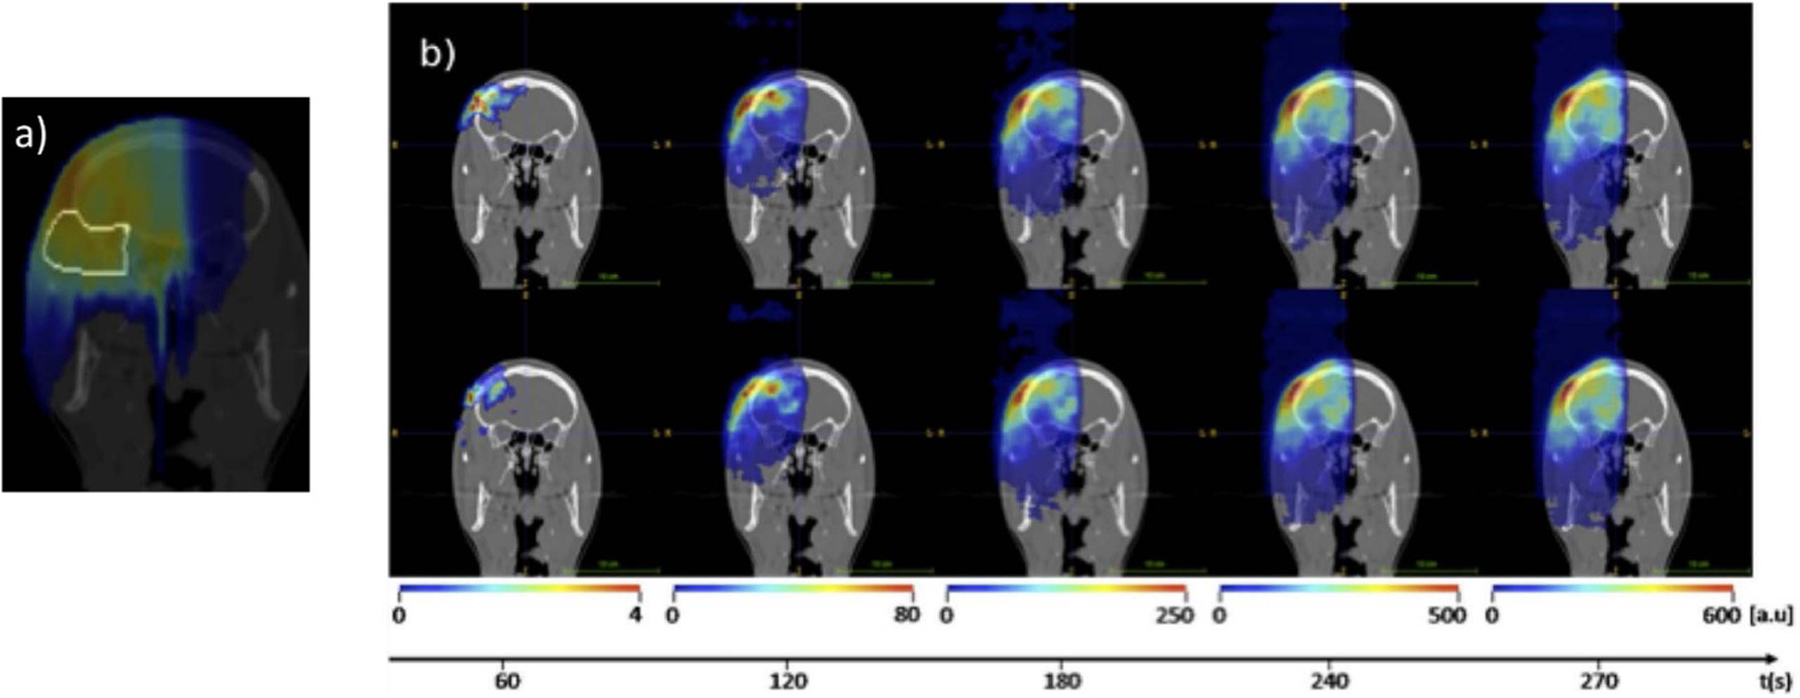
Figure 22.

Example of planned dose distribution (a) and dynamically reconstructed PET activation (b) during proton beam delivery in two different treatment fractions (top and bottom raw), as monitored by the new INSIDE in-beam PET scanner at CNAO. The shown PET images, superimposed onto the same planning CT of (a), were reconstructed at the end of every minute after start of treatment, while the final right image corresponds to decays occurred during the entire treatment and 30 s afterwards. Adapted from (Ferrero et al 2018).
