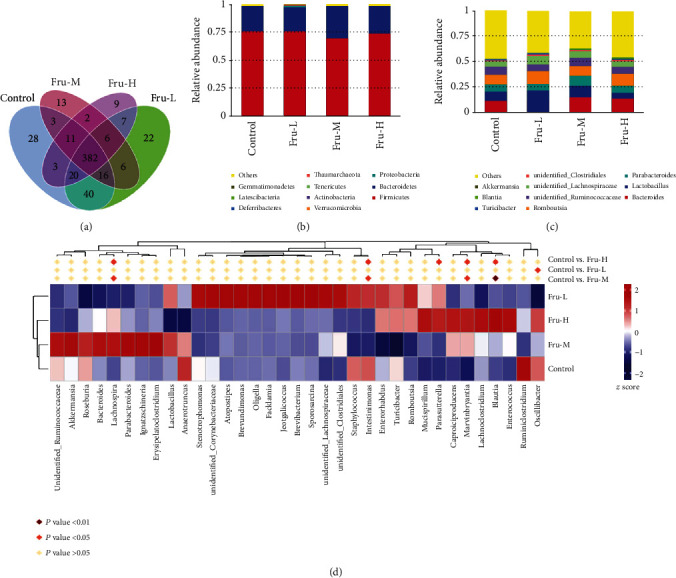
Figure 5.

Effect of fructose in different dosages on gut microbiota of rats. (a) Venn diagram displays OTUs among the four groups in colonic contents (n = 6 per group); (b) analysis of relative abundance of microbiota at the phylum level in colonic contents; (c) analysis of relative abundance of microbiota at the genus level in colonic contents; (d) heatmaps of genus. Control, administration of saline solution; Fru-L group, administration of a low dosage of fructose (2.6 g/kg/day); Fru-M group, administration of a moderate dosage of fructose (5.3 g/kg/day); Fru-H group, administration of a high dosage of fructose (10.5 g/kg/day).
