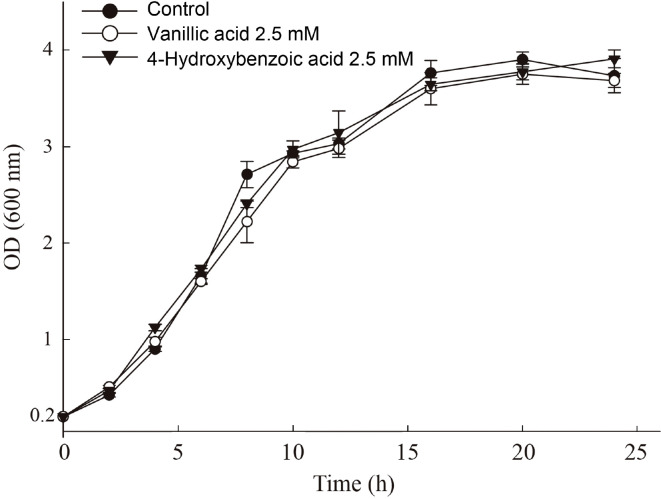
Fig. 3.
Growth curve analysis of Pseudomonas syringae pv. tomato DC3000 treated with 4-hydroxybenzoic acid and vanillic acid. Optical density (OD600nm) of bacterial culture was measured every 2 h until 12 h after starting incubation and then every 4 h after peaking at the onset of the stationary phase. Each point indicates the average value of OD600nm of three replicates with error bar representing the standard deviation.

