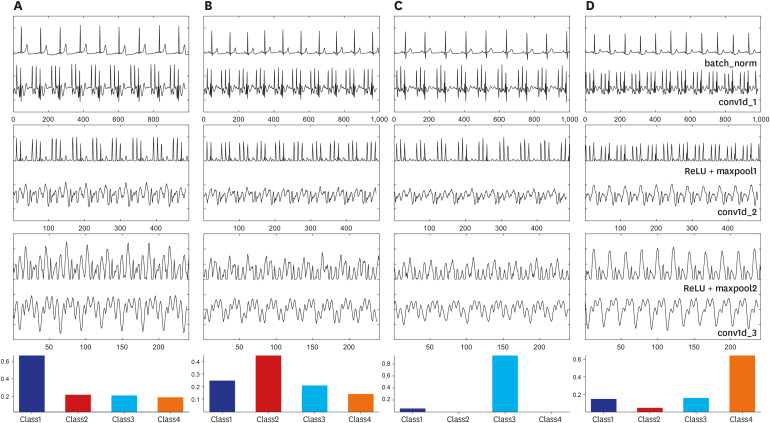
Fig. 4. Example of the output of the designed CNN model for the automatic prediction of SA using normal sinus rhythm. Intermediate features of (A) normal, (B) mild, (C) moderate, and (D) severe cases. (batch_norm–output signal of the batch-normalization layer; conv1d_1–output of first convolutional layer; ReLU+maxpool1–output of ReLU activation and max-pooling layers; conv1d_2–output of second convolutional layer; ReLU+maxpool2–output of second ReLU activation and max-pooling layers; and conv1d_3–output of last convolutional layer). The bottom bar graph is the final probability value after discrimination has occurred in the fully connected layer (class1– normal group; class2– mild group; class3– moderate group; and class4– severe group).
CNN = convolutional neural network, SA = sleep apnea, ReLU = rectified linear unit.

