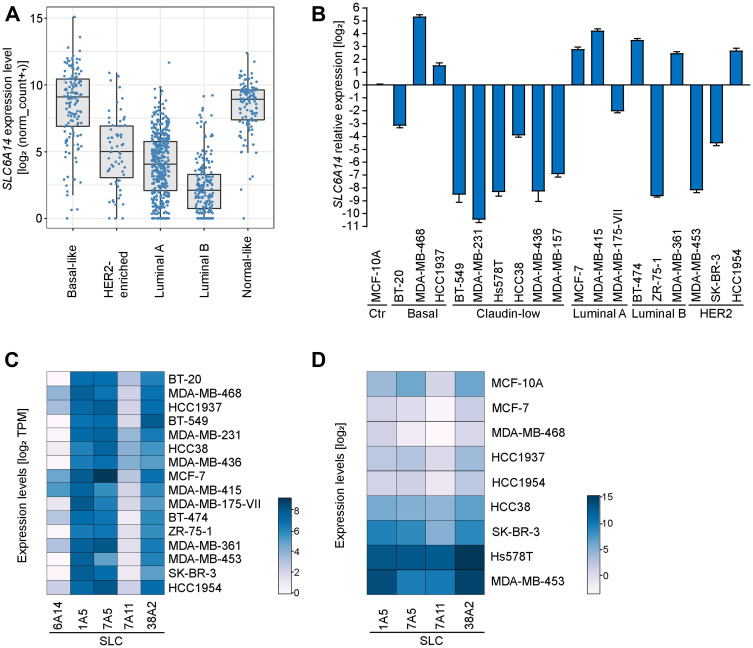
Figure 1. SLC6A14 expression levels in human breast tumors and cancer cell lines.
(A) SLC6A14 mRNA levels in human breast cancer samples divided by subtypes. Data analysis performed using the Breast Invasive Carcinoma (BRCA) dataset from TCGA with available PAM50 annotations (n = 522). Transcript levels are pan-cancer normalized. P-values were calculated using a Mann–Whitney U test (each subtype compared to the basal-like subtype [p = 3.8e-11 HER2-enriched; p < 2e-16 Luminal A; p < 2e-16 Luminal B; p = 0.12 Normal-like]). (B) RT-qPCR of SLC6A14 mRNA levels in breast cancer cell lines divided by subtypes. Data are representative of 3 independent experiments. Error bars indicate standard deviation of technical triplicates. (C) Heatmap showing the expression levels of 5 genes encoding amino acid transporters in breast cancer cell lines. Data are obtained from the DepMap database (version 20Q2) and expressed as TPM (Transcript Per Million). (D) Heatmap showing the expression levels of 4 genes encoding amino acid transporters in selected breast cancer cell lines. Data are obtained by RT-qPCR analysis and are representative of 3 independent experiments.

