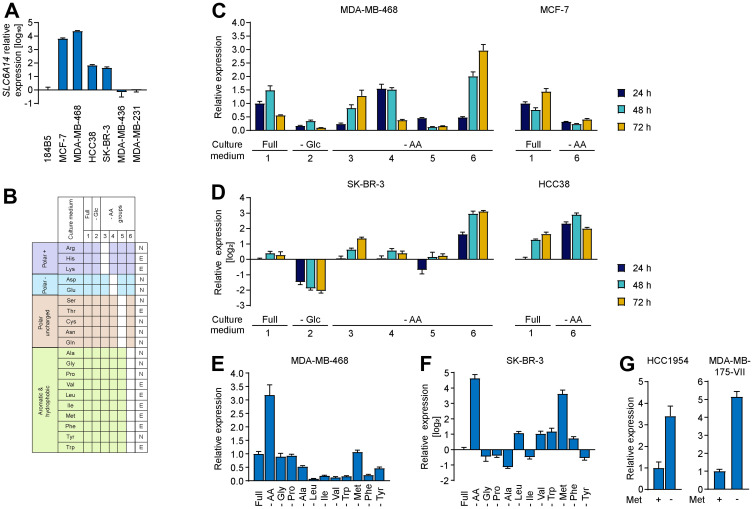
Figure 3. Changes in SLC6A14 expression levels upon amino acid stress.
(A) RT-qPCR of SLC6A14 mRNA levels in selected breast cancer cell lines. Error bars indicate standard deviation of technical triplicates. (B) Schematic indicating the culture conditions used for characterizing the transcriptional stress response. The 20 amino acids are grouped based on their chemical properties (left column) The white boxes indicate the metabolites not included in the medium formulation. In the right column amino acids are classified as essential, E, or non-essential, N. (C and D) RT-qPCR of SLC6A14 mRNA levels in the indicated breast cancer cell lines upon metabolic stress. Data are representative of 3 independent experiments. Error bars indicate standard deviation of technical triplicates (n = 3 (MDA-MB-468; SK-BR-3; HCC38), n = 2 (MCF-7)). (E and F) RT-qPCR of SLC6A14 mRNA levels in MDA-MB-468 and SK-BR-3 breast cancer cell lines upon removal of the indicated amino acids for 72 h. Data are representative of 3 independent experiments. Error bars indicate standard deviation of technical triplicates. (G) RT-qPCR of SLC6A14 mRNA levels in HCC1954 and MDA-MB-175-VII breast cancer cell lines in the presence or absence of methionine for 72 h. Error bars indicate standard deviation of technical triplicates.

