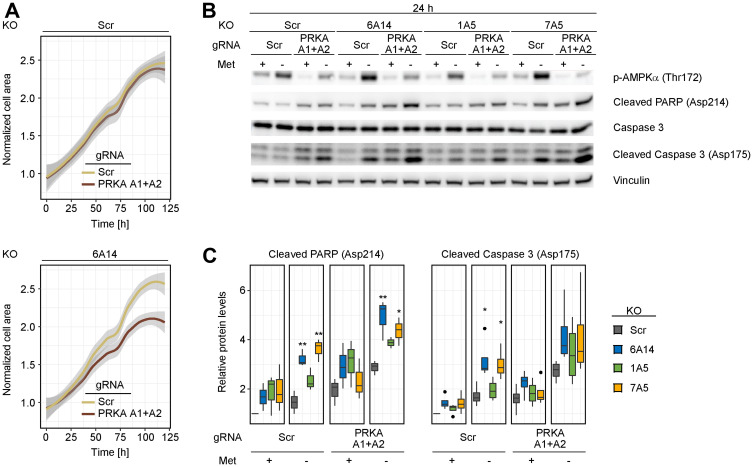
Figure 5. Combined depletion of AMPK and SLC6A14 induces cell death in response to methionine starvation.
(A) Cell proliferation analysis of inducible MDA-MB-468 KO cell lines upon AMPK inhibition. Control and SLC6A14 inducible KO cells were treated with doxycycline for 4 days and transfected with a scrambled gRNA or gRNAs targeting PRKAA1 and PRKAA2. Three days post transfection equal number of cells were plated on a 96-well plate in full medium and the cell proliferation was followed over 5 days using the Incucyte Imaging system. The images were analyzed using the ImageJ software by calculating the area occupied by the cells. Data represent mean of 3 replicates. The grey shade area indicates the 95% confidence interval. Statistical significance was tested with a Mann–Whitney U test. Significant P-values were obtained in the SLC6A14 KO cell line (p ≤ 0.01 at 36 h, 48 h, 60 h, 72 h, 84 h, 96 h, 120 h; p ≤ 0.001 at 108 h). (B) Immunoblots of inducible MDA-MB-468 KO cell lines upon metabolic stress and AMPK inhibition. Inducible KO cell lines were treated as in (A). Three days post transfection equal number of cells were plated on a 6-well plate and cultured for 24 h in the indicated media: Full = complete medium; - Met = medium without methionine. (C) Immunoblot quantification. Boxplots represent values from ≥ 3 independent experiments. In the boxplots, centerlines mark the medians, box limits indicate the 25th and 75th percentiles, and whiskers extend to 5th and 95th percentiles. P-values are calculated based on an ANOVA test followed by Tukey pairwise comparisons (** p ≤ 0.01; * p ≤ 0.05).

