
Figure 3.
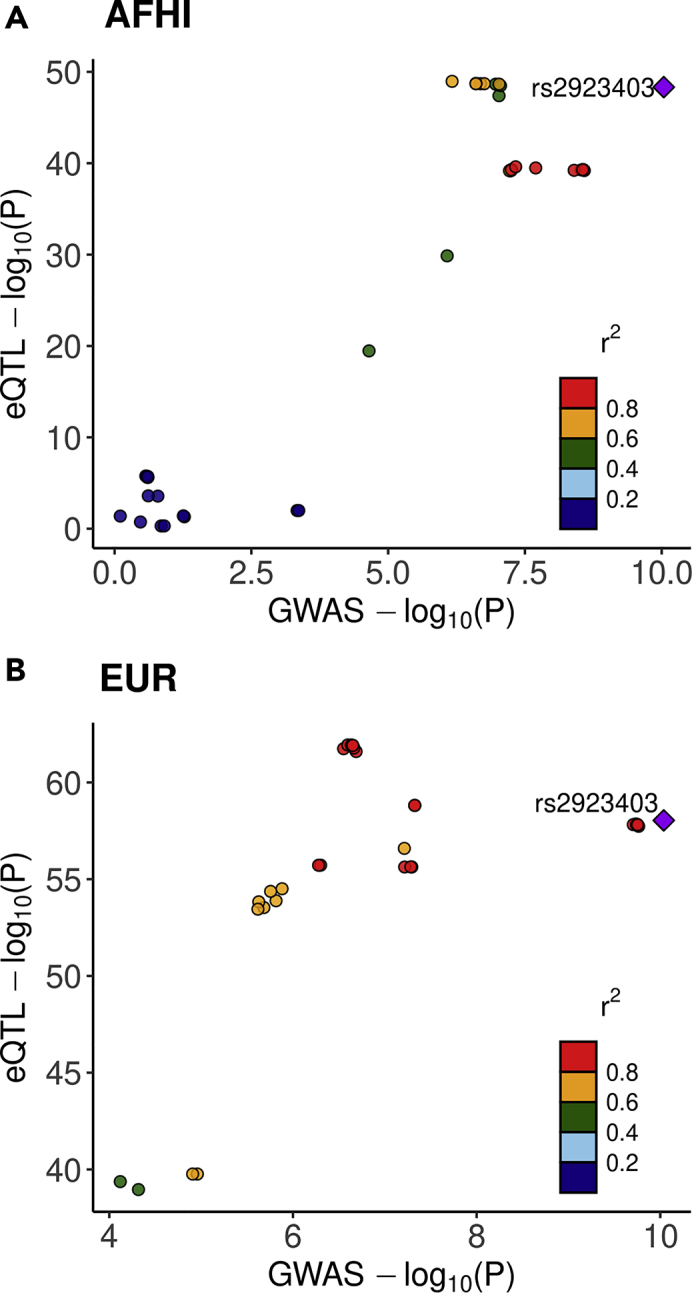
SMIM19 GWAS and eQTL Signals are Colocalized in AFHI, but not EUR
LocusCompare (Liu et al., 2019) plots for mean corpuscular hemoglobin concentration (MCHC) PAGE GWAS p values compared to (A) AFHI MESA eQTL p values and (B) EUR MESA eQTL p values of SNPs in the SMIM19 prediction models. When most points are located on the diagonal, it indicates the GWAS and eQTL signals are likely colocalized. The lead SNP in the AFHI eQTL and PAGE GWAS, rs2923403, is located among the top signals and in the upper right corner, supporting the COLOC evidence for colocalization AFHI (P4 = 0.90). When using EUR eQTL data in COLOC, the GWAS and eQTL signals did not colocalize (EUR P4 = 0.047). Points are colored according to the pairwise LD r2 with rs2923403 in (A) AMR and (B) EUR 1000 Genomes populations.