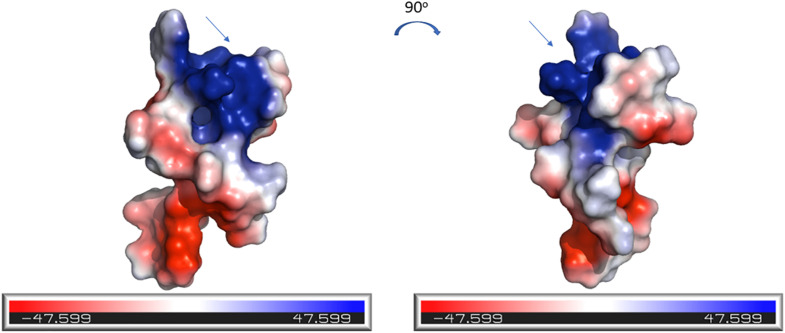
FIGURE 7.
Electrostatics visualization of the surface of CMB001. The blue end of the color gradient represents positive charge and the red end represents negative charge. The arrow indicates the N-terminal region of the molecule. Visualization was generated using the PyMOL Molecular Graphics System, Version 2.0 Schrödinger, LLC.

