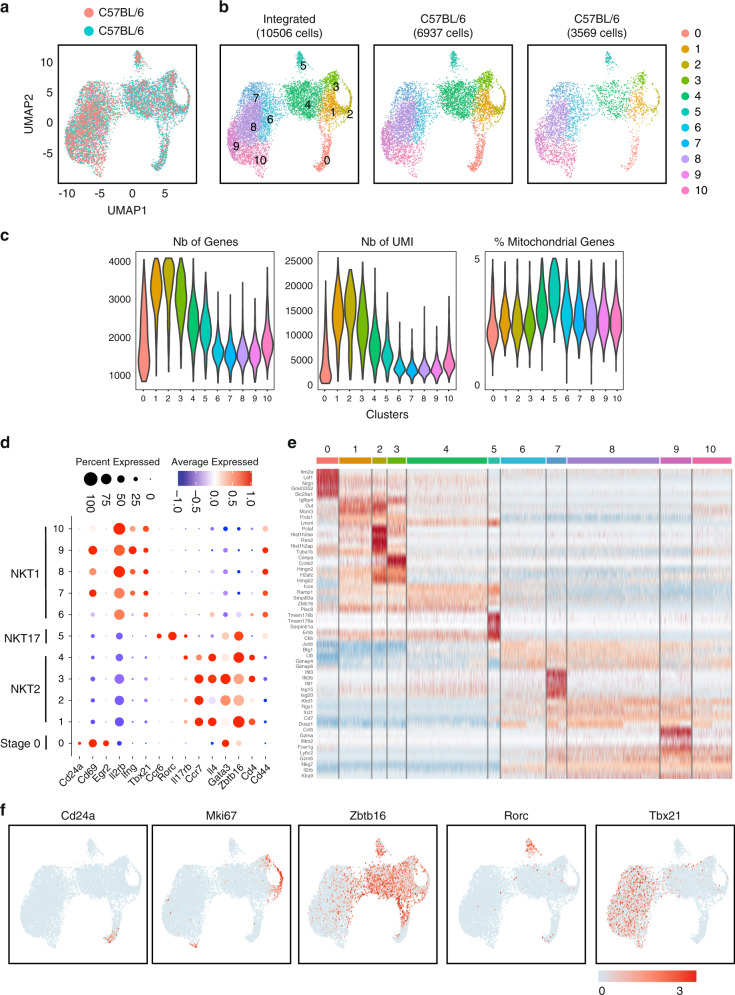
Fig. 1. scRNA-seq analysis of steady-state C57BL/6 thymic iNKT cells.
a Uniform manifold approximation and projection (UMAP) of two independent scRNA-seq data sets from C57BL/6 thymic iNKT cells integrated using FastMNN and colored by sample of origin. b UMAP of 10,506 iNKT cells colored by inferred cluster identity. c Violin plot depicting the number of gene, number of UMI and percentage of mitochondrial genes expressed in each cluster. d Dot plot showing scaled expression of selected signature genes for each cluster colored by average expression of each gene in each cluster scaled across all clusters. Dot size represents the percentage of cells in each cluster with more than one read of the corresponding gene. e Heatmap showing row-scaled expression of the 5 highest differentially expressed genes (DEGs, Bonferroni-corrected P-values <0.05, Wilcoxson-test) per cluster for all iNKT cells. f Expression of five typical genes used to define most common iNKT cell subsets and cycling cells.

