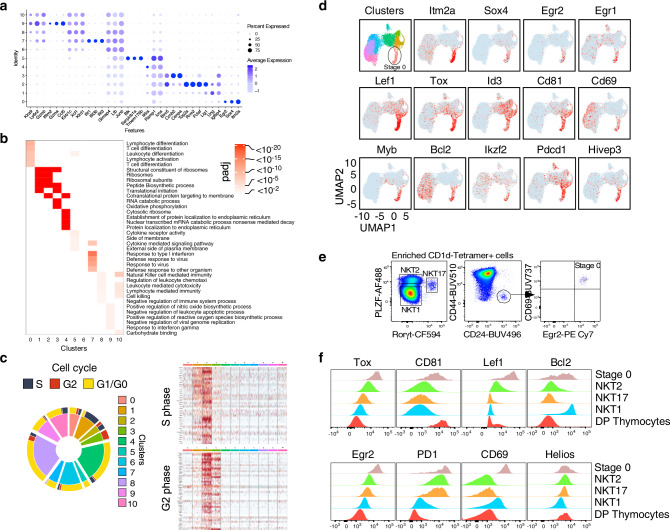
Fig. 2. Thymic iNKT subsets display distinct gene expression profiles.
a Dot plot showing scaled expression of the top 3 highest DEGs for each cluster colored by average expression of each gene in each cluster scaled across all clusters. Dot size represents the percentage of cells in each cluster with more than one read of the corresponding gene. b Gene ontology (GO) analysis of DEGs for each cluster. Selected GO terms with Benjamini–Hochberg-corrected P-values <0.05 (one-sided Fisher’s exact test) are shown. Heatmaps display Padj value significance of enrichment of GO terms in each cluster. c Pie plot depicting the proportion of cells in each cluster and for each cluster the proportion of cells in each phase of the cell cycle. Heatmap showing row-scaled expression of cell cycle-related genes for each cluster. d Expression patterns of fourteen stage 0 iNKT-specific genes in our scRNA-seq data. Each dot represents one cell and gene expression is plotted along a colorimetric gradient, with red corresponding to high expression. e Gating strategy to identify stage 0, iNKT1, iNKT2 and iNKT17 cell subsets by flow cytometry. f Histograms displaying protein expression levels by flow cytometry within each iNKT subset for the indicated proteins. Protein expression in DP thymocytes is also displayed as a control. Data are representative of at least 2 independent experiments for each marker.

