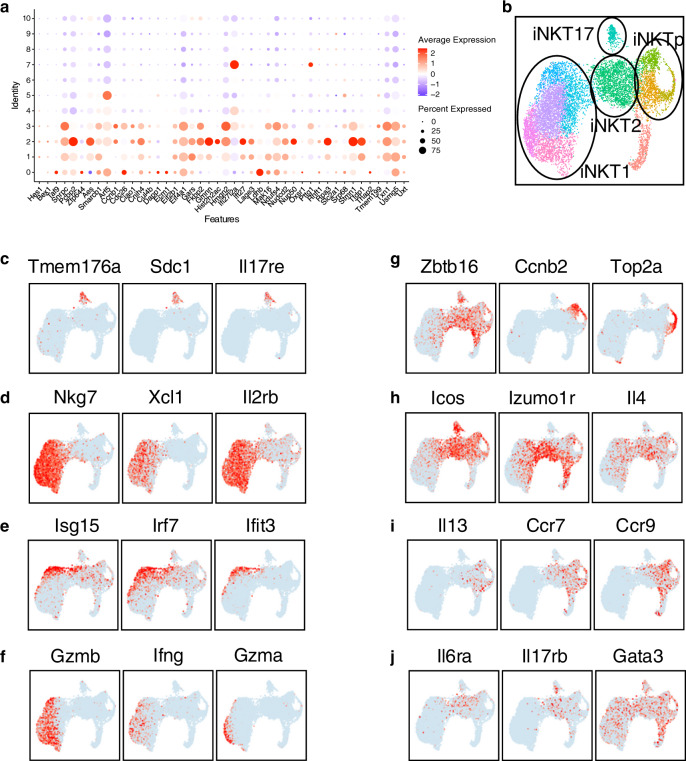
Fig. 3. Gene expression profile of stage 0 iNKT cells.
a Dot plot showing scaled expression of the 44 genes previously described as the iNKTp signature, for each cluster colored by average expression of each gene in each cluster scaled across all clusters. Dot size represents the percentage of cells in each cluster with more than one read of the corresponding gene. b Summary of the UMAP defined in Fig. 1 with major NKT subset populations defined by gates. c Expression of three typical genes used to define iNKT17 cells. d Expression of three typical genes used to define iNKT1 cells. e Expression of three typical genes used to define interferon signaling genes. f Expression of three typical genes used to define cells in cluster 9. g–j Expression of twelve genes used to illustrate and define the diversity amongst iNKT2/cycling cells.

