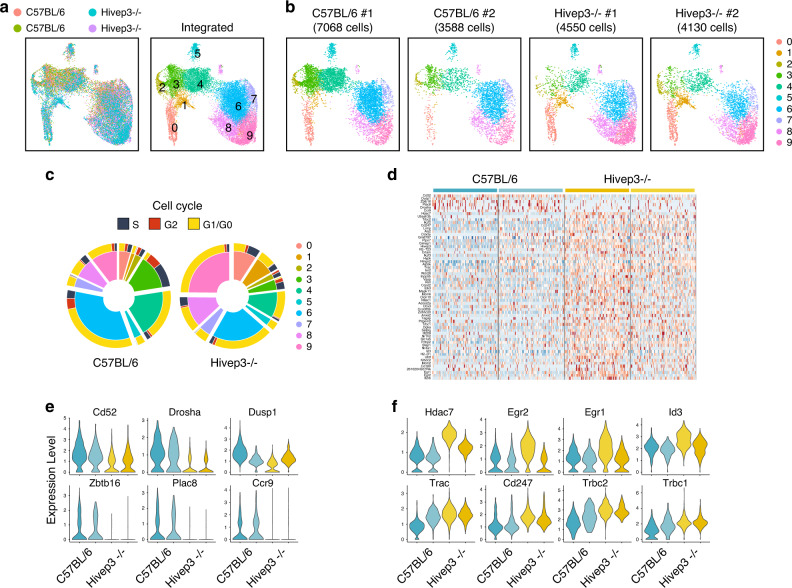
Fig. 5. scRNA-seq analysis of steady-state thymic iNKT cells from Hivep3−/− mice.
a Left, Uniform manifold approximation and projection (UMAP) displaying two independent scRNA-seq data sets from C57BL/6 and two independent Hivep3−/− thymic iNKT cells colored by sample of origin after MNN batch-correction. Right, UMAP colored by inferred cluster identity for the integrated dataset. b Individual UMAP plots for each biological sample in the dataset, with the sample and number of cells passing quality control and filtering indicated above each plot. c Cell cycle scores were computed for each cell in the dataset using the R Seurat package and then categorized into S, G2 or G1/G0 phases. Pie charts depict the proportion of C57BL/6 (Left) and Hivep3−/− (Right) cells within each cluster belonging to a given phase of the cell cycle. d Heatmap displaying expression levels of 65 differentially expressed genes across stage 0 iNKT cells in the dataset. The sample to which a given cell belongs are indicated at the top of the heatmap. e, f Violin plots displaying aggregate expression levels per sample of genes that are expressed higher in C57BL/6 (e) or higher in Hivep3−/− (f) stage 0 iNKT cells.

