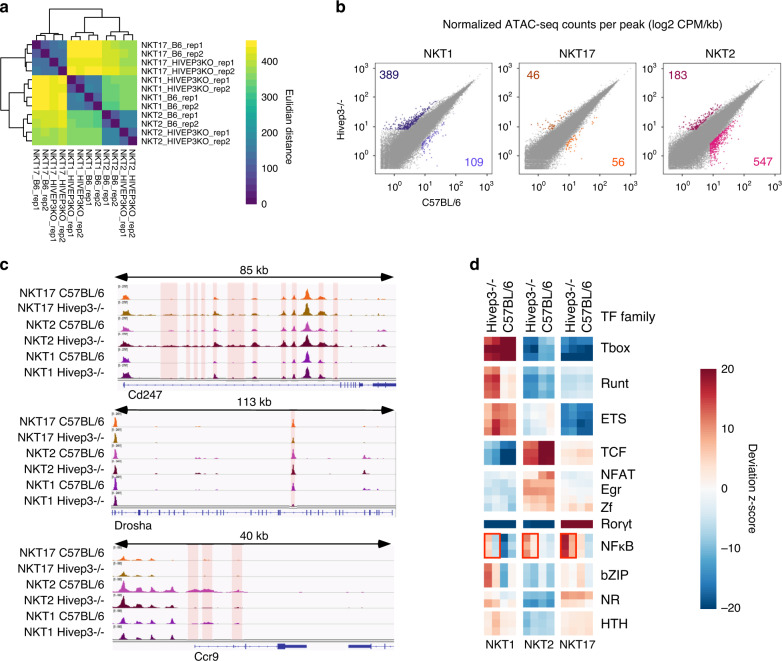
Fig. 7. Hivep3 deficiency impacts the chromatin landscapes of thymic iNKT cell subsets.
a Euclidean distance values were computed for the iNKT1, iNKT2 and iNKT17 ATAC-seq samples from both C57BL/6 and Hivep3−/− mice. b Scatterplots of mean ATAC-seq counts per peak comparing iNKT1, iNKT2 and iNKT17 subsets between C57BL/6 and Hivep3−/− mice. c Mean ATAC-seq coverage at the Cd247, Drosha and Ccr9 loci in all samples is depicted. Differentially accessible loci are highlighted in red. d Motif enrichment for iNKT1, iNKT2 and iNKT17 subsets across both strains within the differentially accessible regions is depicted as a heatmap. NF-κB binding motifs are enriched in the differentially accessible regions in the Hivep3−/− samples and this is indicated with red boxes.

