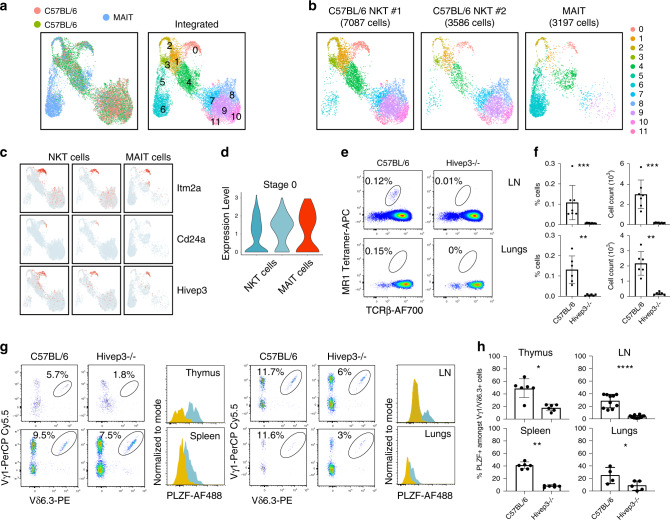
Fig. 8. Hivep3 deficiency universally impacts PLZF-expressing innate-like T lymphocytes.
a Left, UMAP displaying two iNKT and one MAIT scRNA-seq sample colored by sample of origin after MNN batch-correction. Right, UMAP colored by inferred cluster identity for the integrated dataset. b Individual UMAP plots for each biological sample in the dataset, with the sample and number of cells passing quality control and filtering indicated above each plot. c Expression of selected genes in the iNKT and MAIT scRNA-seq samples. Each dot represents one cell and gene expression is plotted along a colorimetric gradient, with red corresponding to high expression. d Violin plots displaying aggregate expression levels of Hivep3 in stage 0 cells for each sample. e MAIT cells in C57BL/6 and Hivep3−/− mice were identified in the indicated tissues by staining with the MR1 tetramer and an antibody targeting TCRβ. f Quantified MAIT cell proportions and numbers in C57BL/6 and Hivep3−/− mice in each of the indicated tissues. Data are from two independent experiments with a total of 5-7 mice per group. LN: p = 0.0002 and p = 0.0022, Lungs: p = 0.0022 and p = 0.0022 for percentages and absolute numbers, respectively. g Vγ1+ Vδ6.3+ γδ T cells in C57BL/6 and Hivep3−/− mice were identified in the indicated tissues by staining with antibodies targeting Vγ1 and Vδ6.3. PLZF expression in these cells from each tissue is plotted as an overlaid histogram with C57BL/6 cells colored in blue and Hivep3−/− cells colored in yellow. h Quantified PLZF+ Vγ1+ Vδ6.3+ cell proportions in C57BL/6 and Hivep3−/− mice in each of the indicated tissues. Thymus p = 0.0108, LN p = 0.0002, Spleen p = 0.0022, Lungs p = 0.0022. Data are from 2–3 independent experiments with a total of 6-7 total mice per group. All the data are mean ± SD with dots representing individual values. Source data are provided as a source data file.

