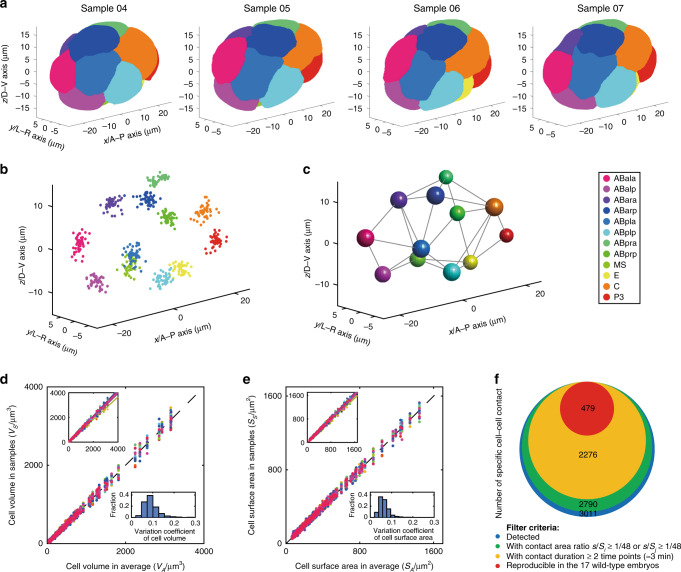
Fig. 3. A morphological atlas during C. elegans embryogenesis.
a–c Different dimensions of a standardized spatiotemporal reference, illustrated using the 12-cell stage as an example. The x, y, and z axes represent the anterior–posterior (A–P), left–right (L–R), and dorsal–ventral (D–V) axes, respectively, and each color denotes one specific blast cell as indicated. a 3D representations of four wild-type embryos reconstructed with membrane label (Samples 04–07). b Spatial distribution of cell position (nuclei) of 46 embryos (Samples 04–49). c Cellular spatial deviation and reproducible cell–cell contact mapping. The sphere radius represents spatial deviation Δr defined by the root-mean-square deviation (RMSD, , where N denotes the total number of embryos and ri denotes the cell position in the ith embryo). Each gray line represents reproducible and effective contact between cells under specific filter criteria: scontact/Ssurface ≥ 1/48, Tcontact ≥ 3 min, Nreplicate = Nembryo (see “Methods”). d, e Reproducibility and variability of cell volume and cell surface area, tested using proportionally normalized data from all 322 cells with a complete lifespan (Supplementary Data 3). Each color represents an individual embryo. Top-left insets: data graphed using original data prior to normalization. Bottom-right insets: variation coefficients of each cell among the 17 embryos using the normalized data. f Criteria for defining effective cell–cell contact (red). The whole pool of cell–cell contacts detected and the ones filtered out through different criteria are symbolized by circles with different areas and colors. Source data are provided as a Source Data file.

