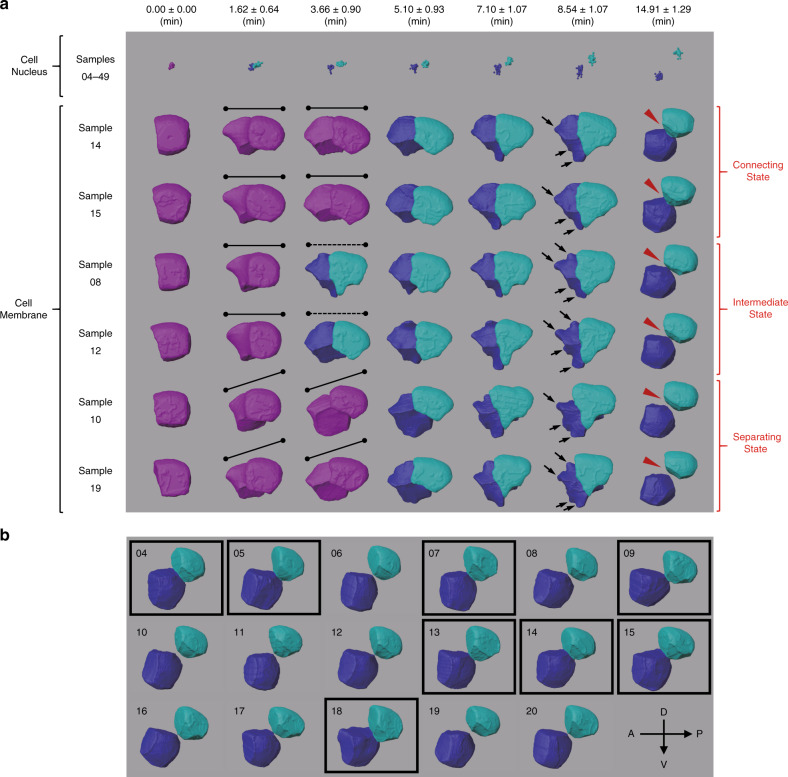
Fig. 5. Morphological dynamics at single-cell resolution.
Time-lapse 3D cell shapes during C. elegans embryogenesis for ABp (purple) and its daughter cells, ABpl (blue) and ABpr (cyan). Horizontal and vertical axes represent anterior–posterior (A–P) and dorsal–ventral (D–V) axes, respectively. a Morphological dynamics are shown as in Fig. 4c for the time points immediately before and after AB2 divisions (columns 1–2), before and after EMS division (columns 3–4), before and after P2 division (columns 5–6) and before AB4 divisions (column 7) (Supplementary Data 2). The first row shows the cell position (nuclei) distributions obtained from all 46 wild-type embryo samples (04–49). The second to seventh rows show reconstructed cell morphologies from embryo samples segmented with membrane markers. Embryo Samples 08, 10, 12, 14, 15, and 19 were selected to demonstrate the morphological dynamics of ABp and its daughter cells. Note that in the second and third columns the division orientation of ABp is marked by solid and dashed lines for unseparated and separated daughter cells, respectively. In the sixth column, sharp humps on the ABpl’s surface are highlighted by black arrows. In the last column, ABpl and ABpr can be observed in a connecting state, intermediate state or separating state, exemplified by Samples 14 and 15, Samples 08 and 12, Samples 10 and 19, respectively. b Position and morphology of ABpl (blue) and ABpr (cyan) at the time point prior to AB4 divisions. The embryo samples with ABpl-ABpr cell pairs in a connecting state are highlighted by black squares.

